Figures & data
Figure 1. Preparation and characterization of the protein LT and its active analog LTE. (a) The schematic diagram for conformation of the recombinant protein LDP-TIMP2 (LT) and the reconstitution of its enediyne-integrated analog LDP(AE)-TIMP2 (LTE). (b) The protein purity analysis using HPLC system. (c) The reconstitution of enediyne-integrated analog LTE, determined by reverse-phase HPLC system. (d) Molecular weight of the protein LT, measured by 5800 MALDI-TOF/TOF system. (e) The far-UV (190–250 nm) CD spectra of the protein LT, analyzed by JASCO715 system.
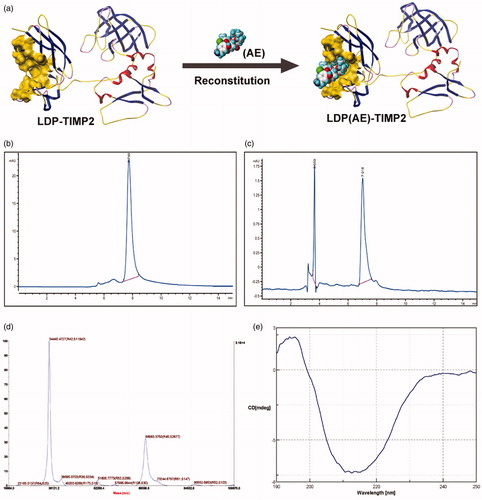
Figure 2. In vitro binding activity analyses. (a) Binding efficiency of 5 μM FITC-conjugated protein LT or LDP to HT1080 and A549 cells, determined by FACS analysis. The experiment was carried out in triplicate. (b) Binding activity of different concentrations of FITC-conjugated protein LT to HT1080 and A549 cells via FACS analysis. HT1080 or A549 cells without LT (FITC) served as the control. Each experiment was performed in triplicate. (c) Binding affinity of the protein LT to living HT1080 cells was analyzed by confocal microscope, the representative image was obtained by the LEICA TCS SP5 System (Leica Microsystems GmbH, Wetzlar, Germany). The overlay image was with FITC-conjugated protein LT (green), DiI staining (red), and DAPI staining (blue).
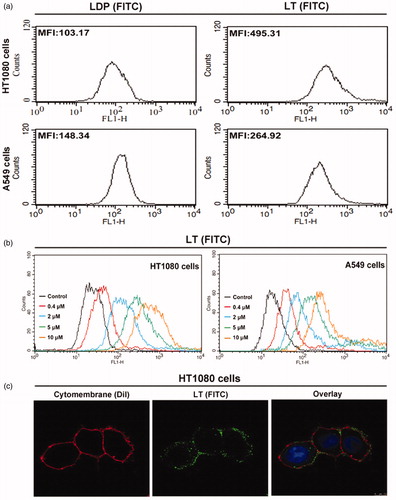
Figure 3. Binding capability of the protein LT via tissue microarray. (a) Different classifications according to the clinicopathological features, such as age, gender, organ, and pathology diagnosis. Score 1 + indicates the weak binding, score 2 + indicates the moderate binding, and score 3 + or more indicates strong binding. Student’s t-test was used for analyzing the statistical difference among groups. Data were analyzed by one-way ANOVA in the table. (b) The classification of staining intensity in malignant, benign and inflammation (and NAT), *p < .05, showing significant difference. (c) The classification of staining intensity according to pathology diagnosis. (d) Representative cases showing classification of binding capability. The HE staining was performed by AlenaBio (Xi’an, China), and used for showing tumor area.
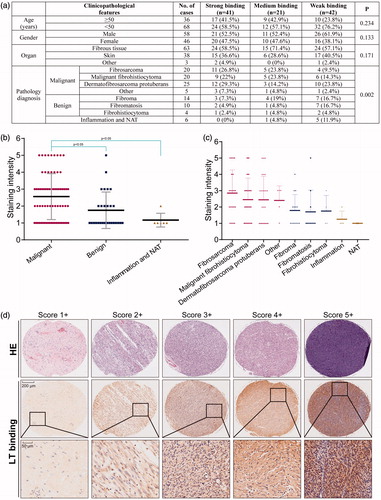
Figure 4. The bioactivity analyses of protein LT and active analog LTE. (a) HT1080 cells treated with protein LT and LDP for 48 h (upper left), A549 cells treated with protein LT and LDP for 48 h (upper right); HT1080 cells treated with the active analog LTE and LDM for 48 h (lower left), A549 cells treated with the active analog LTE and LDM for 48 h (lower right). *p < .05, versus control, without treatment with tested agent, while **p < .01, versus control. The experiment was performed using Cell Counting Kit-8 assay. Results were obtained from six times of repeated experiments. (b) The proportion of apoptotic cells (the early and late) was presented as the average value of three times of independent experiments, respectively. (c) Active analog LTE-induced G2/M arrest in HT1080 and A549 cells after 24 h incubation. (d) Percentage of G2/M arrest in HT1080 and A549 cells treated with different concentrations of the active analog LTE. Statistical analysis of three times of independent experiments. Cells without treatment served as the control. *p < .05, against control. Each experiment was performed in triplicate.
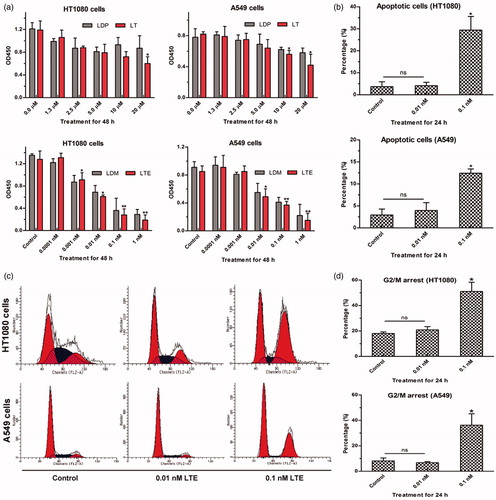
Figure 5. LTE inhibited the invasion and migration of HT1080 cells. (a) The representative images of LTE-induced inhibition of invasion in HT1080 cells after 24 h incubation. (b) The representative images of LTE-induced inhibition of migration in HT1080 cells after 24 h incubation. (c) Statistical analysis shows that LTE treatment caused a significant decrease in cell invasion. (d) Statistical analysis shows that LTE treatment caused a significant decrease in cell migration. In both invasion and migration analyses, cells without treatment served as the control. Columns, mean; Error bars, SD. *p < .05, against control. #p < .05, against 0.01 nM treatment group. Each experiment was performed in triplicate.
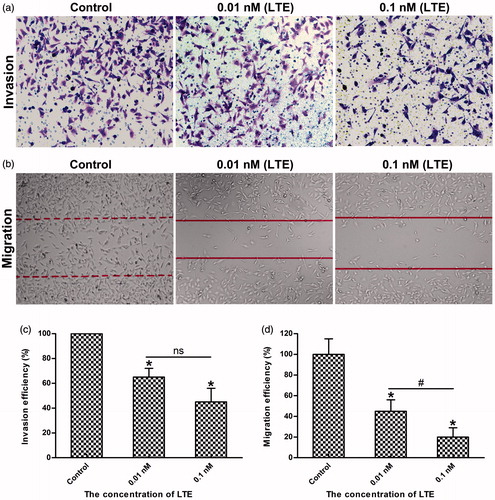
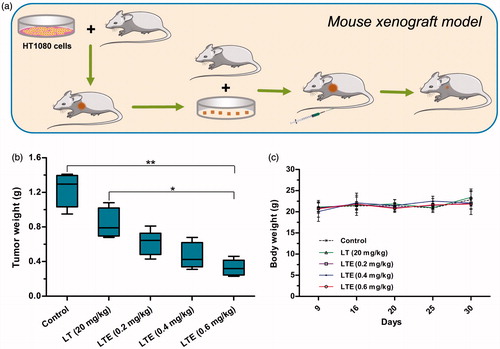
Figure 6. In vivo antitumor efficacy of LTE against fibrosarcoma HT1080 xenografts in athymic mice. (a) Mouse xenograft model and treatment. (b) Tumor weights in different treatment groups and the control group. *p < .05, the 0.6 mg/kg LTE group versus 20 mg/kg LT group; **p < 0.01, the 0.6 mg/kg LTE group versus the control group. (c) Body weight change of the HT1080 xenograft-bearing mice during the observation period.