Figures & data
Table 1. Composition of SLNs loaded with Fluconazole and FLZ-SLNs topical gels (% w/w).
Table 2. Characterizations of selected FLZ SLNs.
Figure 1. In vitro release profiles of FLZ from (a) prepared SLNs and (b) relevant SLNs gels.
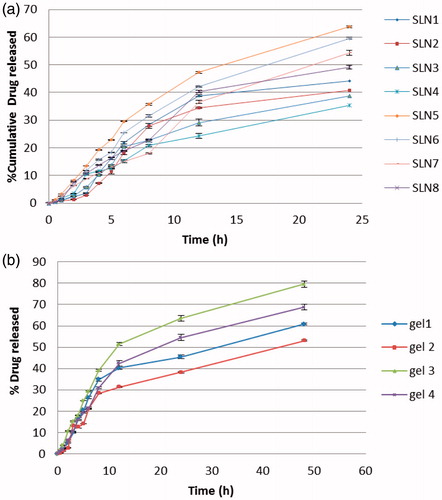
Figure 2. Mean of healing percentage measured in patients at first, second, third, and fourth week of different treatments application. Capital letters represent the significance of same treatment at different weeks. Small letters represent the significance between different treatments within the same week. Error bars represent standard error (SE).
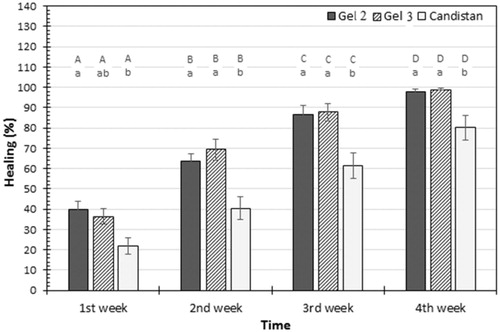
Figure 3. Photographic pictures before and after treatment with (a) gel 2 and (b) gel 3.
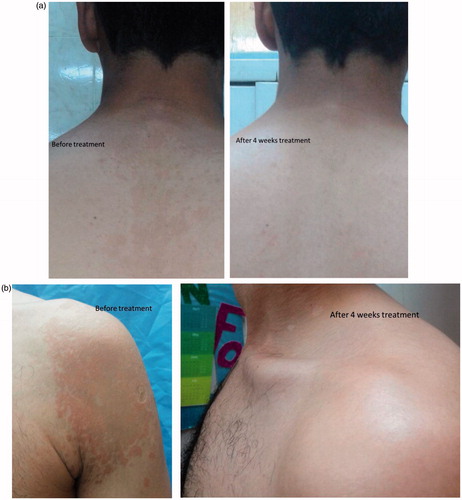
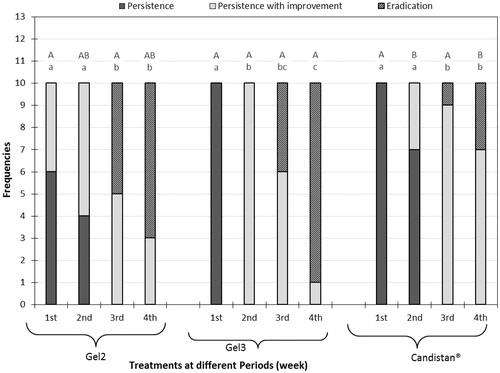
Figure 4. Mycological results representation of gel 2, gel 3, and Candistan® cream with pairwise comparison at each weak; capital letters represent the significance of same treatment at different weeks and small letters represent the significance between different treatments within the same week.