Figures & data
Table 1. Primer sequence.
Figure 1. (A) Morphology of microencapsulated Raw 264.7 cells at 4×10⁶ cell/ml density under the inverted optical microscopy (left panel) and fluorescence microscopy after calcein/ethidium staining the day after encapsulation. The last image on the right corresponds to the merge image of both staining. Scale bar 200 μm. (B) Metabolic activity of encapsulated Raw 264.7 cells measured by the Cell Counting Kit 8 (CCK-8) assay for three weeks. N = 3. Data are means ± SD..
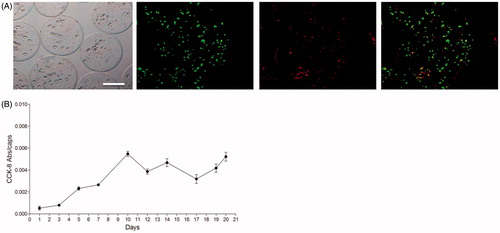
Figure 2. Induction of the anti-inflammatory M2 state of Raw 264.7 cells with or without microencapsulation. IL-10 and TNF-alpha production of Raw 264.7 cells determined by ELISA when 2 ng/ml of IL-10 is added into the culture media before encapsulation (A), in the alginate matrix (B), or without encapsulation but with IL-10 addition once (C). N = 3. Data are means ± SD, *p < .05 versus control basal levels.
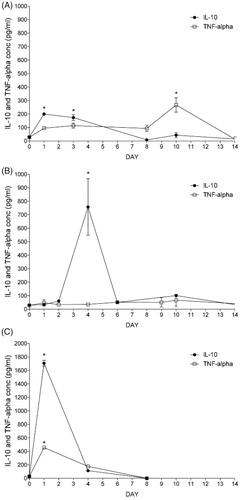
Figure 3. Fluorescence microscope images of encapsulated Raw 264.7 cells stained with calcein AM (live cells, column 1) and ethidium homodimer (dead cells, column 2) at day 4 post-encapsulation. Control capsules (A), 2 ng/ml of IL-10 added into the culture media before encapsulation (B), or 2 ng/ml of Il-10 added in the alginate matrix (C). Column 3 represents the merged image from columns 1 and 2.
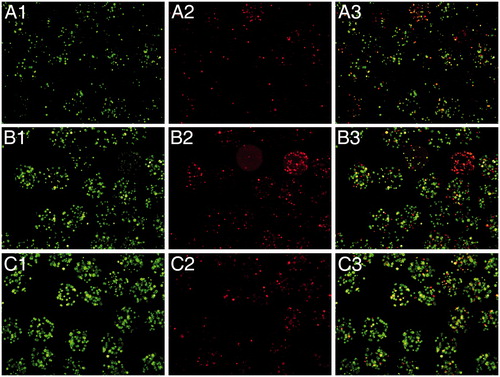
Figure 4. Effect of anti-inflammatory M2 supernatants on epithelial to mesenchymal transition markers. Phase contrast images and immunofluorescence of phalloidin, vimentin, megalin, and cytokeratin18 (CK-18) in ASC untreated (Control); ASC treated with ATRA for 7 days (ATRA); below ATRA withdrawal for 24 h (−ATRA); ATRA withdrawal followed by anti-inflammatory macrophages conditioned medium for 24 h following (−ATRA + M2CM)), Phase-contrast images and phalloidin staining of F-actin cytoskeleton (red) nuclei (blue). In addition, immunofluorescence of vimentin (green), nuclei (blue). Immunocytochemistry of CK18, nuclei counterstained with hematoxylin. Immunofluorescence of megalin (green), nuclei (blue). Images were obtained by phase contrast microscopy, immunofluorescence, and immunocytochemistry. Magnification 20×.
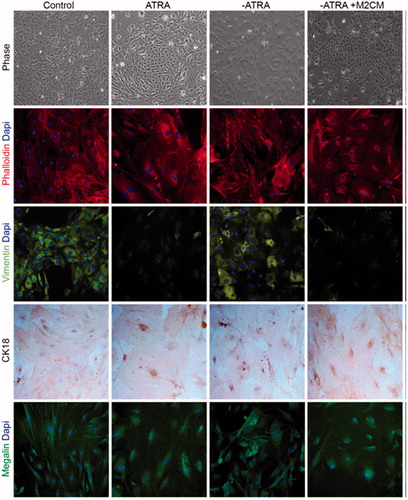
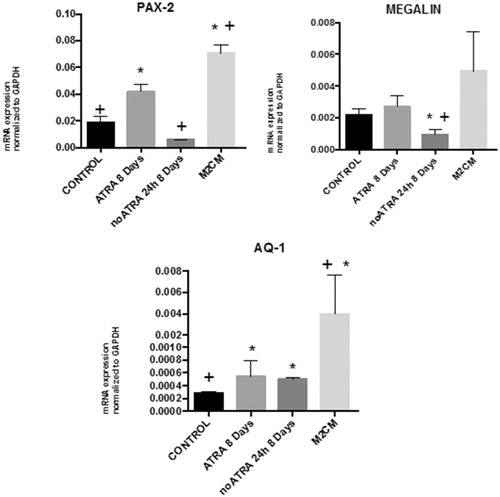
Figure 5. qRT-PCR analysis of PAX-2, MEGALIN, and AQUAPORIN-1. Total RNA was extracted from ASC untreated (Control); ASC treated with ATRA for 7 days (ATRA), below ATRA withdrawal for 24 h (−ATRA), treated with anti-inflammatory macrophages conditioned medium for 24 h following ATRA withdrawal (−ATRA + M2CM). N = 4. Data are means ± SD. *p < .05 versus untreated. +p < .05 versus ATRA.