Figures & data
Figure 1. Downregulation of CAR proteins in bladder cancer. (A) CAR expression in bladder cancer according to a protein atlas (www.proteinatlas.org). (B) Bladder tumors and matched normal urothelium from NMIBC patients were harvested, fixed with 1% formaldehyde and were analyzed with anti-CAR antibodies following the standard protocol. (C) Bladder cancer cells were grown in 100 cm2 dishes and CXADR transcripts were evaluated using RT-PCR, as stated in the Methods.
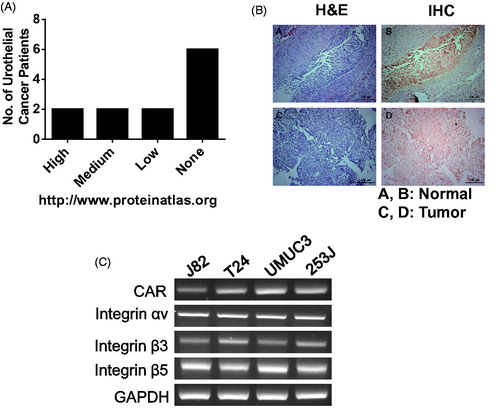
Figure 2. Enhancement of adenovirus infectivity to bladder cancer cells with the aid of aminoclay. (A) Aminoclay is synthesized in the presence of ethanol from magnesium silicate and has positive charges with multiple amino groups. (B) J82, T24, 253 J and UMUC3 were infected with different MOI of Ad5CMVGFP in the presence or absence of aminoclay: 100 MOI for J82, and T24, 10 MOI for 253 J and 5 MOI for UMUC3. (C) Cells were infected with a fixed dose of aminoclay of 250 μg plus Ad5CMVGFP and then observed under a fluorescence inverted microscope (20 × magnification). For counting GFP-expressing cells upon Ad5CMVGFP infection, Ad5CMVGFP was mixed with various concentrations, ranging from 0 to 750 μg, and incubated with 1 × 10⁶ cells for 24 h. GFP-expressing cells were determined by flow cytometry.
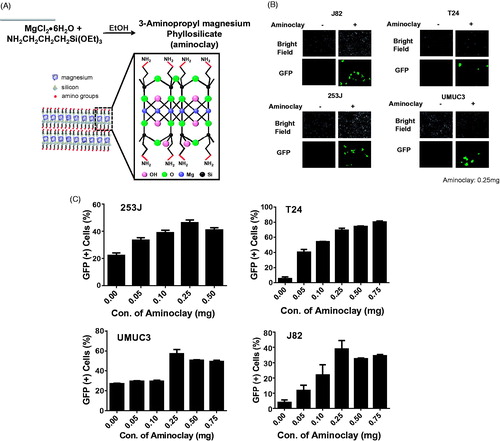
Figure 3. Enhanced adenoviral infectivity to MBT-2 aided by aminoclay. (A) Total RNA was obtained from cells prepared in 100-cm2 dishes and CAR expression was investigated by amplifying CAR transcripts in 1 µg of total RNA. (B) MBT-2 cells of 1 × 10⁵ were infected with Ad5CMVGFP of 8 × 10⁷ PFU alone or together with aminoclay of 0–1 mg aminoclay. GFP expression was observed under a fluorescence inverted microscope (20 × magnification). (C) The number of GFP-expressing MBT-2 cells was analyzed using flow cytometry at 24-h postinfection.
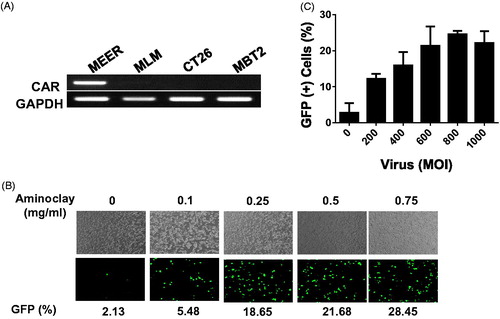
Figure 4. Enhanced infectivity of the adenovirus/aminoclay complex to a MBT-2 xenograft. (A) Subcutaneous MBT-2 tumors in C3H were implanted and were intratumorally injected with Ad5CMV luciferase of 5 × 10⁸ PFU alone or plus 500 μg of aminoclay. Bioluminescence was detected using the IVIS system (Perkin Elmer). ROI values of luminescence produced from luciferase gene expression and were presented as fold changes compared to adenovirus alone. (B) MBT-2/Luc bladder orthotopic tumors were implanted and tumor formations generating luminescence were confirmed, as described in the Methods. Tumors in the bladder were treated with Ad5CMVβgal of 5 × 10⁸ PFU alone or together with aminoclay of 500 μg. After 24 h, whole bladder organs were fixed with 1% formaldehyde and were sliced for β-gal assays. Ad5CMVβgal infectivity to tumors inside the bladder was compared under an inverted microscope (10× magnification).
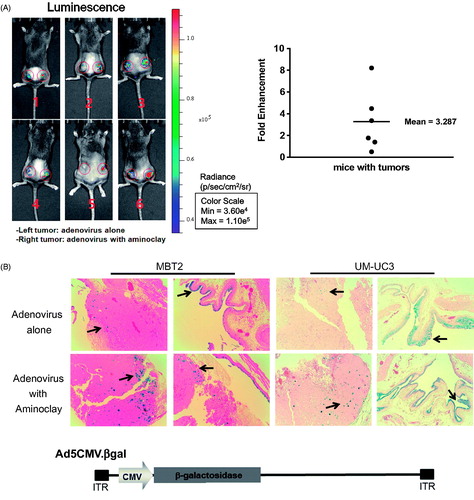
Figure 5. Physicochemical characteristics of adenoviruses complexed with aminoclay. (A) MBT-2 cells of 1 × 10⁷ were treated with PBS or 250 or 500 μg/ml of aminoclay. Membrane resistance was evaluated by measuring TEER. (B) Adenovirus of 8 × 10⁷ PFU and 500 μg of aminoclay were mixed and estimated for surface charges under different pH conditions.
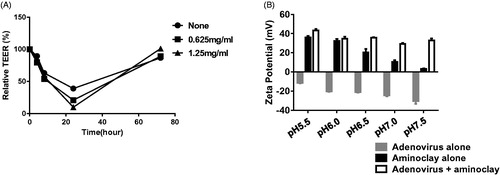
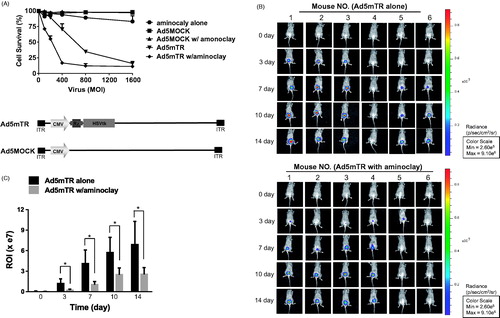
Figure 6. Enhanced tumor suppressive ability of adenoviruses in the presence of aminoclay. (A) MBT-2 cells of 1 × 10⁴ in 96-well plates were infected with increasing doses of Ad5MOCK or Ad5mTR. 500 μg of aminoclay were mixed with adenovirus prior to addition to cells. Cells were treated with prodrug GCV and their viabilities were measured 3 days later using an MTS kit. (B) MBT-2/Luc bladder orthotopic tumors were implanted and were instilled with tumor-targeting Ad5mTR of 5 × 10⁸ PFU alone or together with aminoclay. In vivo tumor suppressive activity by Ad5mTR was evaluated with ROI of luminescence taken by IVIS. (C) During in vivo tumor suppressive activity, ROI values were plotted at the different time points. * indicates the statistical significance. Two-tailed p values <0.05 were considered significant. STATA/SE version 10.1 software (StataCorp LP, College Station, TX) was used for the analysis.