Figures & data
Figure 1. The characteristics of ADH-1-modified liposomes (A-LP). (A) Schematic illustration of A-LP. (B) MALDI-TOF MS spectra of ADH-1-PEG-DSPE. The arrow indicates the peak of ADH-1-PEG-DSPE. (C) Size distribution graph of A-LP by dynamic light scattering analysis. (D) Transmission electron microscopy image of A-LP. Scale bar is 50 nm. (E) In vitro cumulative leakage profile of coumarin-6 from liposomes in PBS at 37 °C at 100 rpm (mean ± SD, n = 3).
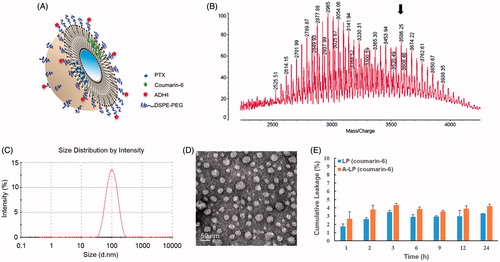
Figure 2. Acquisition of PTX resistance induces morphologic changes and specific protein changes consistent with EMT in MCF7 cells. (A) PTX-sensitivity assay in parental MCF7 and MCF7 PTX-R cells. IC50 values of parental MCF7 and MCF7 PTX-R cells were 77.7 nM and 320.7 nM, respectively. (B) Cell morphology of parental MCF7 and MCF7 PTX-R cells was observed by microscopy at ×10 magnification. The parental MCF7 cells had an epithelioid and paving stone appearance. In contrast, MCF-7 PTX-R cells (black arrows) adopted spindle-shaped or pear-like morphology and showed a decrease in cell-cell contacts. (C) The expression of EMT-related markers in parental MCF7 and MCF7 PTX-R cells. (D) MCF7 PTX-R cells exhibit increased expression of N-cadherin located in cell membrane. Immunofluorescence staining for N-cadherin was done on MCF7 PTX-R cells and parental cells. Cell nuclei were stained with DAPI.
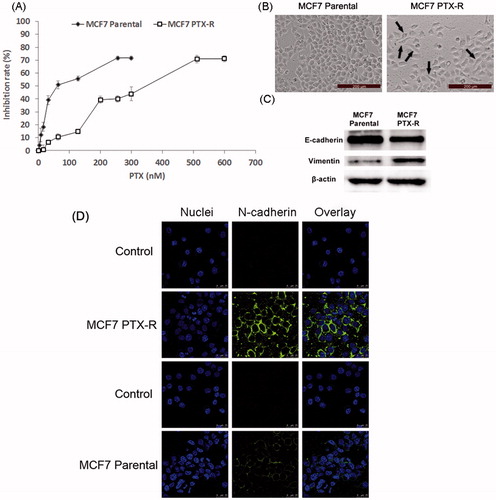
Figure 3. Targeted delivery to MCF7 PTX-R and parental cells by confocal microscopy analysis (A) and flow cytometry studies (B and C). Cells were treated with LP (cou), A-LP (cou) or A-LP (cou) preincubated with free ADH-1 (2 μM) for 1 h at 37 °C for 3 h. Data are presented as mean ± SD (n = 3). *p < .05, versus LP (cou) or A-LP (cou) pre-incubated with free ADH-1.
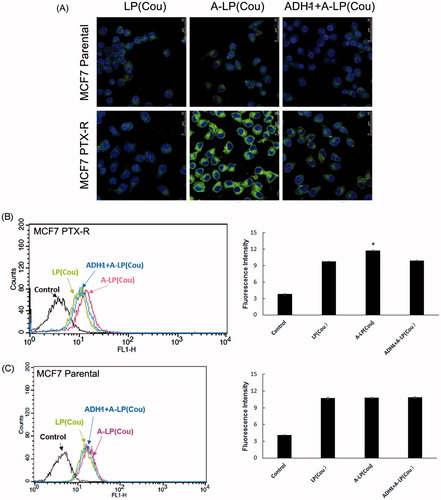
Figure 4. (A) Chemosensitivity evaluation of PTX-loaded A-LP in MCF7 PTX-R cells. MCF7 PTX-R cells were treated with free PTX, LP/PTX or A-LP/PTX for 48 h at 37 °C by CCK-8 assay. Each bar represents mean ± SD (n = 3). *p < .05, vs LP/PTX or free PTX; **p < .01, vs LP/PTX or free PTX. (B) A-LP/PTX suppresses the EMT process on MCF7 PTX-R cells. Changes in the protein expressions of the epithelial marker E-cadherin and the mesenchymal marker N-cadherin were analyzed by western blotting. β-actin was used as a loading control. MCF7 PTX-R cells were treated with (a) complete RPMI-1640, (b) LP/PTX, (c) A-LP/PTX, (d) ADH-1 for 24 h.
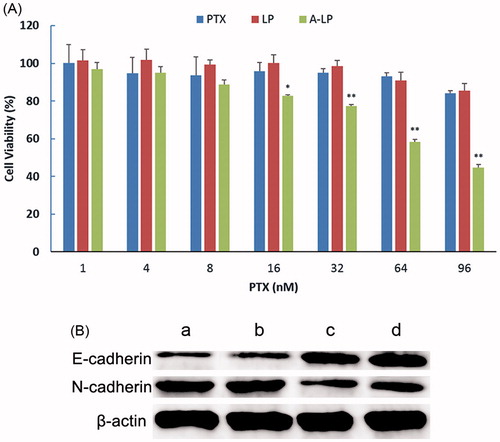
Figure 5. Migration inhibition effect of ADH-1-modified liposomes (A-LP/PTX) on MCF7 PTX-R cells. (A) Wound scratch assays were performed with a uniform scratch using a 200-μL pipette tip. Then, the cells were washed with culture media to remove any free-floating cells and debris and incubated in culture medium containing LP/PTX, A-LP/PTX, free ADH-1 (2 μM) before treated with PTX (A/PTX) or free ADH-1 (2 μM) alone for 24 h and observed at ×5 magnification with inverted microscope. (B) Relative motility was calculated using 10 randomly chosen distances across the wound at 0 h and 24 h. **p < .01, versus LP/PTX. (C) Optical images of cells (white arrows) on the bottom surface of the Transwell inserts after treatment with LP/PTX, A-LP/PTX, free ADH-1 (2 μM) before treated with PTX (A/PTX) or free ADH-1 (2 μM) alone for 24 h. (D) The inhibition rate was calculated by counting cells that migrated through polycarbonate membranes of the inserts. *p < .05, versus LP/PTX.
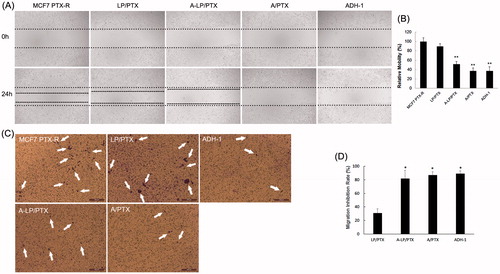
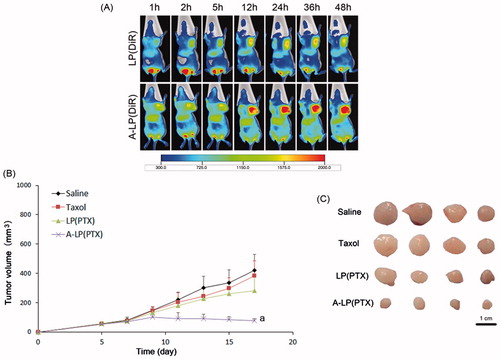
Figure 6. (A) In vivo fluorescent images of tumor bearing mice at different time points after i.v. injection of LP (DiR) or A-LP (DiR). (B) Tumor growth curve of MCF7 PTX-R cells baring nude mice treated with saline, Taxol, LP (PTX) or A-LP (PTX). a, p < .05 versus saline, Taxol or LP (PTX) formulation. (C) Photograph of the tumors excised at the end of the test. Scale bar =1 cm.