Figures & data
Figure 1. (A) Synthesized scheme of PEI-R8. (B) Schematic representation of the formation and in vivo gene therapy of HPR/phTRAIL nanoparticles.
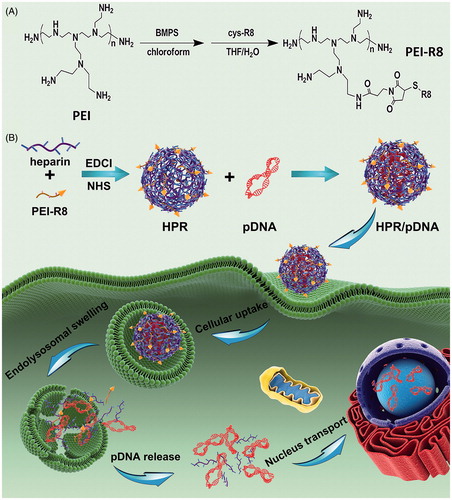
Figure 2. Characterization of HPR. (A) 1 H-NMR spectrums of PEI and PEI-R8. (B) Size distribution of HPR and HPR/phTRAIL. (C) Zeta potential of HPR and HPR/phTRAIL. (D and E) TEM images of HPR and HPR/phTRAIL respectively. (F) Plasmid DNA condensation of HPR. (G) Cytotoxicity of HPR in HCT-116 cells.
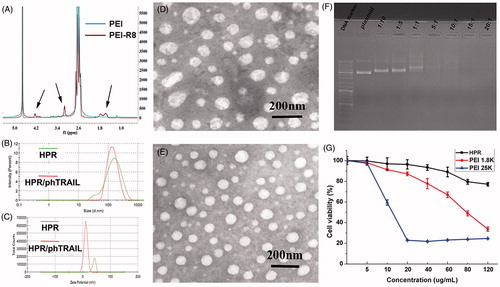
Figure 3. LSCM images of HCT-116 cells following incubation with HPR/pDNA nanoparticles at 37 °C for 0.5, 1, 2, 4 h. Plasmid DNA was labeled with YOYO-1. Endolysosomes were stained with LysoTracker-Red and cell nuclei were stained with DAPI.
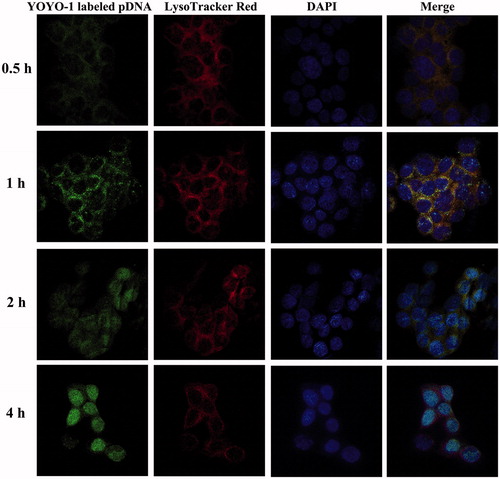
Figure 4. In vitro transfection efficiency of HPR. (A, B and C) Fluorescence microscopy images of HCT-116 cells after transfected with PEI1.8 K/pGFP, PEI25K/pGFP and HPR/pGFP respectively. (D) Quantitative analysis of transfection efficiency of PEI1.8 K, PEI25K and HPR.
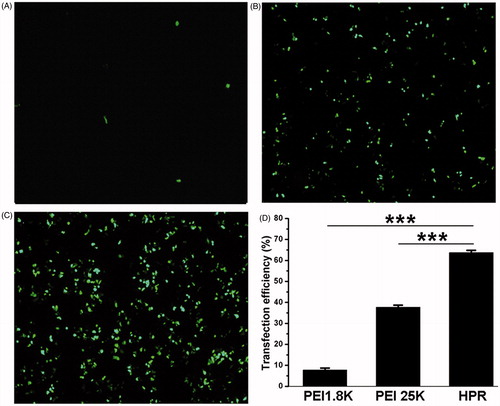
Figure 5. In vitro apoptosis evaluation. (A) Different treatments (NS, PEI25K/pMCS, PEI25K/phTRAIL, HPR, HPR/pMCS and HPR/phTRAIL) induced apoptosis in HCT-116 cells. Annexin V and PI-stained cells were measured by flow cytometry. (B) The percentages of Annexin V-positive HCT-116 cells after different treatments. (C) Expression levels of apoptosis-related proteins in HCT-116 cells detected by Western blot assay after different treatments.
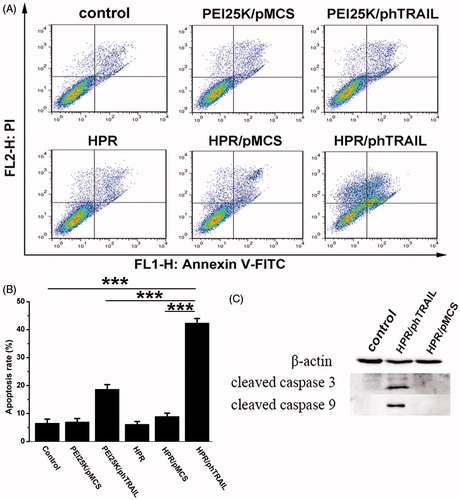
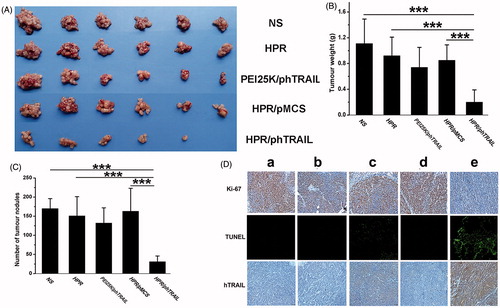
Figure 6. Antitumor effect of HPR/phTRAIL in vivo. (A) Photos of HCT-116 abdominal metastasis tumor after different treatments. (B and C) Tumor weight and nodules in different treatments. (D) Immunohistochemical analysis of Ki-67, TUNEL and hTRAIL expression of tumors in each group. (a) NS; (b) HPR; (c) PEI25K/phTRAIL; (d) HPR/pMCS; (e) HPR/phTRAIL.