
Figures & data
Figure 1. (A) Synthesis schematics for the GPCC conjugate. CPT was endowed with reductive sensitivity of GSH by the introduction of a disulfide bond via an esterification reaction. CPT was then conjugated to the amine-terminated PAMAM dendrimer via an amidation reaction. The Cy7 tracer was used to label PAMAM to observe the distribution of conjugates in vivo. Finally, glucose-functionalized PEG was linked to PAMAM, which endowed the conjugate with prolonged circulation and GLUT1-targeting abilities. (B) Schematics of the structure of the GPCC conjugate and the action mechanism of enhanced cancer cell targeting and cellular microenvironment-sensitive drug release. The GPCC conjugate first accumulates in tumor tissue through the EPR effect; then, the GPCC conjugate is recognized and endocytosed by glucose transporter 1 (GLUT1)-overexpressing cells through glucose-GLUT1-specific interactions; the endocytosed conjugate is delivered to the cell cytoplasm, where high GSH concentrations trigger intracellular camptothecin release and finally, free drugs act on the nucleus. (C) 1HNMR of different conjugates (from top to bottom: GPCC, MPCC, PCC, and PC).
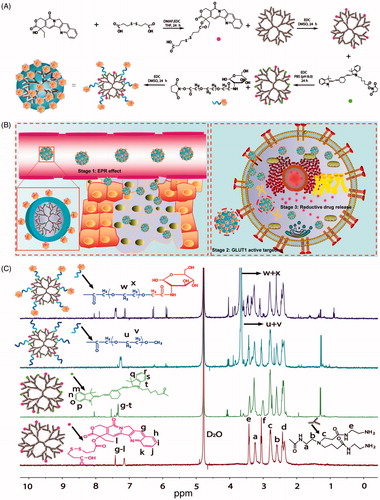
Figure 2. Characteristics of different conjugates. (A) Size distribution of conjugates. (B) Transmission electron microscopy images of conjugates. (C) In vitro CPT release from conjugates under different reductive environments.
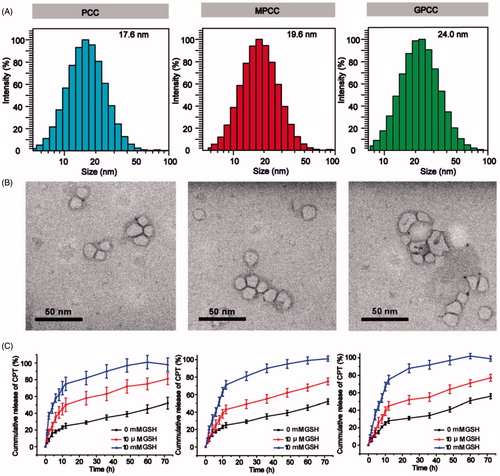
Figure 3. In vitro targeting evaluation of the GPCC conjugate for HepG2 and L02 cells. (A) Qualitative cellular uptake of conjugates by GLUT1+ HepG2 cells compared with GLUT1- L02 cells at different times. (B) Quantitative cellular uptake of conjugates by HepG2 and L02 cells at different times. (C) Images of HepG2 MCTS treated with conjugates at 1 μM for 8 h, images were captured at a z-depth of 100 µm of each MCTS. The GPCC conjugate exhibited significantly enhanced targeting of GLUT1+ HepG2 cells compared with that of other conjugates and that for GLUT1− L02 cells. (D) Subcellular localization of conjugates in GLUT1+ HepG2 cells and GLUT1- L02 cells visualized by confocal fluorescence microscopy. Cells co-incubated with different conjugates at a CPT concentration of 1 μM for 4 h. The white arrows indicate co-localization of the conjugates and the nuclei. *p < .05.
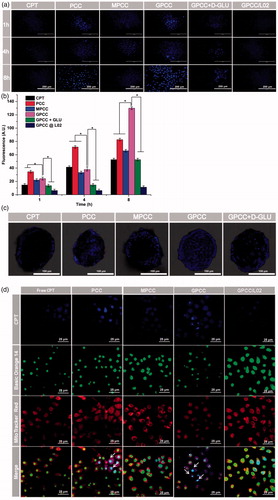
Figure 4. Cytotoxicity of conjugates to GLUT1+ HepG2 cells (A) compared with GLUT1- L02 cells (B) incubated for 24 h; (C) effects of treatment with free CPT, PCC, MPCC, and GPCC on the cell-cycle progression of HepG2 cells; (c1) control cells; (c2) cells treated with free CPT, (c3) PCC, (c4) MPCC, and (c5) GPCC at CPT concentration of 1 μM. (c6) The percent of cell-cycle distribution after treatment with conjugates for 24 h. (D) Apoptosis induction effect of various conjugates on HepG2 cells determined by Annexin V-FITC/PI double staining method; (d1) control cells; (d2) cells treated with free CPT, (d3) PCC, (d4) MPCC, and (d5) GPCC at CPT concentration of 1 μM. *p < .05.
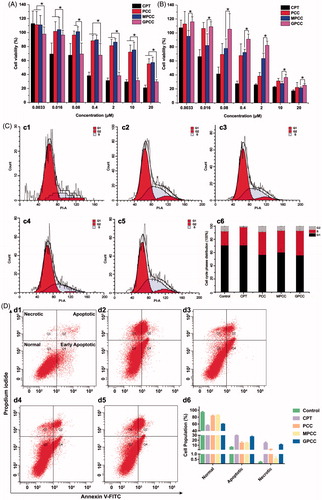
Figure 5. In vivo tumor targeting evaluation of different conjugates visualized by in vivo imaging system. (A) Real-time in vivo imaging distribution of conjugates in H22 tumor-bearing mice at 1, 2, 4, 8, and 12 h after the intravenous injection of conjugates; (B) ex vivo imaging distribution of conjugates in tumors and major organs harvested from the tumor-bearing mice at 12 h; and (C) fluorescence intensity of the excised organs at 12 h. *p < .05.
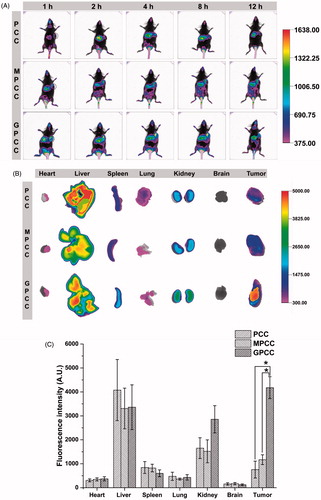
Figure 6. (A) Mean plasma drug concentration–time profiles of CPT in rats after intravenous injection of conjugates at the CPT dose of 1.5 mg/kg; in vivo antitumor efficacy of different conjugates in H22 tumor-bearing mice after intravenous administration of CPT at 1 mg/kg. (B) Body weight change during treatment, (C) image, and (D) weight of tumors obtained from mice at the end of experiment, and (E) H&E staining of tumor, liver, and spleen tissues. The data are means ± SD (n = 6), Data are shown as mean ± SD (n = 6). *p < .05.
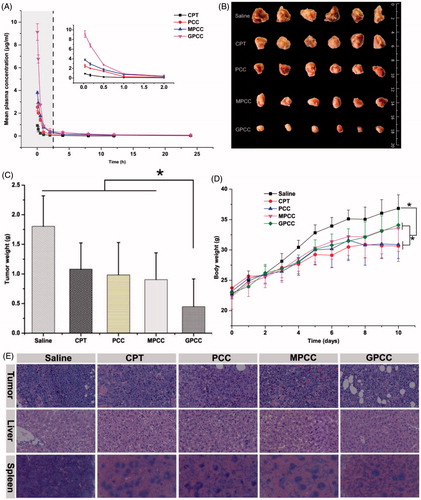
Table 1. Pharmacokinetic parameters of conjugates and CPT suspension after intravenous administration of the 1.5 mg CPT/kg dose.