Figures & data
Figure 1. Synthetic routes of PEOz-NH2 (A) and PEOz-VES (B) copolymers. 1H NMR spectrum of PEOz-NH2 (C) and PEOz-VES in CDCl3 (D).
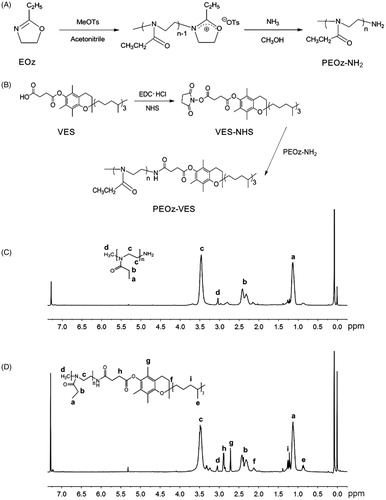
Figure 2. (A) Schematic illustration of self-assembly for PTX/Mix-PMs in aqueous medium. Size (B), Zeta potential (C), and transmission electron microscope images (D) of PTX/Mix-PMs.
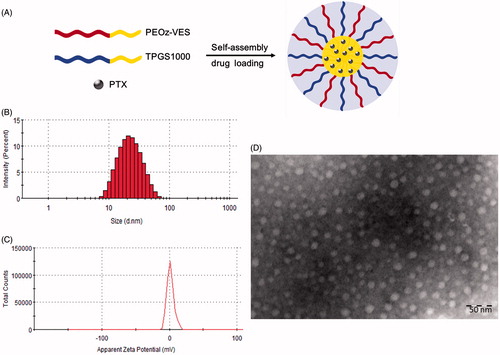
Figure 3. In vitro release profiles of PTX from PTX/PV-PMs (A) and PTX/Mix-PMs (B) in PBS with 0.2% Tween 80 and in simulated intestinal fluid (SIF) with 0.2% Tween 80 (C) at 37 °C (n = 3). (D) The effective permeability of PTX/Mix-PMs and Taxol® in rat intestine (n = 3). *p < .05. (E) Cytotoxicity of blank PV-PMs, TPGS1000-PMs and Mix-PMs to Caco-2 cells after incubation for 6 h (n = 6).
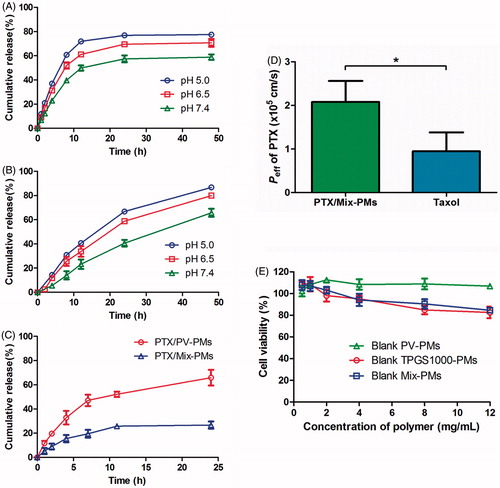
Figure 4. (A) Cytotoxicity of PTX/PV-PMs and PTX/Mix-PMs to Caco-2 cells after incubation for 3 h (n = 6). (B) Apparent permeability coefficients of PTX for different formulations (Taxol®, PTX/PV-PMs, and PTX/Mix-PMs) at 20 μg/mL PTX across Caco-2 cell monolayers from apical (AP) to basolateral (BL) side at 37 °C (n = 3). **p < .01, nsp > .05. (C) Transmission electron microscope images of basolateral medium collected after 3 h of incubation of Caco-2 cell monolayers with PTX/Mix-PMs. (D) Fluorescence emission spectra of basolateral medium collected after 3 h of incubation of Caco-2 cell monolayers with FRET micelles at excitation wavelength of 488 nm. (E) Transport of PTX across Caco-2 cell monolayers after 3 h of incubation with PTX/Mix-PMs under different conditions (n = 3). Papp of PTX (% of control) indicated the percentage of Papp to the control in the absence of any inhibitor at 37 °C. nsp > .05, *p < .05, and **p < .01 compared with the control.
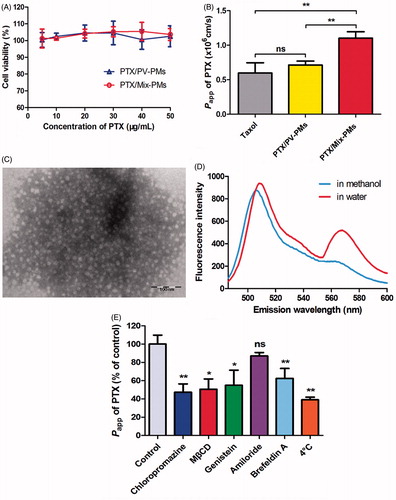
Figure 5. (A) Confocal images of Caco-2 cells in FRET lines after they were incubated with FRET micelles for different time at 37 °C. The Ex/Em of FRET line was DiO/DiI (488/568 nm). (B) CLSM images of colocalization of C6/Mix-PMs with different organelles after incubation of C6/Mix-PMs with Caco-2 cells for 1 h. Green, C6/Mix-PMs; red, specific organelle probes; yellow, colocalization of green and red signals. Late endosomes, lysosomes, endoplasmic reticulum (ER), Golgi apparatus and mitochondria were labeled with CellLight Late Endosomes-RFP, Lyso-Tracker Red, ER-Tracker Red, Golgi-Tracker BODIPY-TR ceramide, and Mito-Tracker Deep Red, respectively. Quantitative colocalization analysis of C6/Mix-PMs with different organelles by determining Pearson’s correlation coefficient (C) and colocalization rate (D).
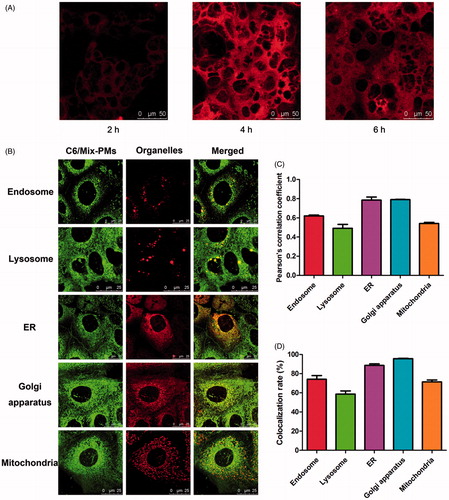
Table 1. The collected proteins from basolateral media and their homing information for Mix-PMs-treated group.
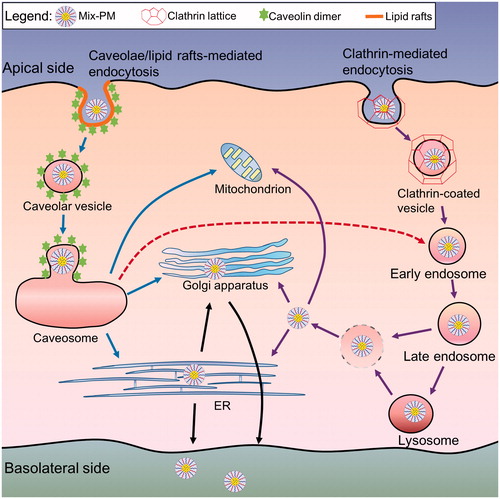
Scheme 1. Schematic diagrams depicting predicted transcellular transport pathways and intracellular trafficking routes of Mix-PMs through Caco-2 cell monolayers.