Figures & data
Table 1. Formulations of RM–in situ gel and RM–MS–Gel ISFI systems.
Figure 1. Low-magnification and high-magnification cold-cathode field-emission scanning electron microscope (FE-SEM) microphotographs of RM-microspheres prepared by (a) O/W single emulsion-solvent evaporation method, (b) W/O/W double emulsion-solvent evaporation method, (c) S/O/W double emulsion–solvent evaporation method, (d) O/O traditional phase separation method and W/O/O emulsion–phase separation method with the drug loading of (e) 7.20%, (f) 17.34% and (g) 26.42%, respectively.
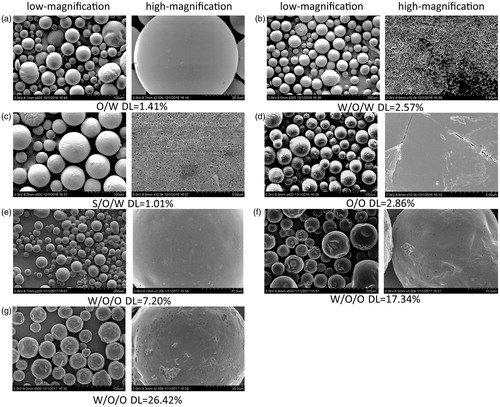
Figure 2. Response surface plots illustrating the effect of ratio of drug to polymer and ratio of organic to aqueous phase on (a) drug loading and (c) encapsulation efficiency (fixed stirring speed = 250 rpm), ratio of organic to aqueous phase and stirring speed on (b) drug loading and (d) encapsulation efficiency (fixed ratio of drug to polymer =1:1.8), ratio of drug to polymer and stirring speed on (e) particle size (fixed ratio of organic to aqueous phase = 7.5:1).
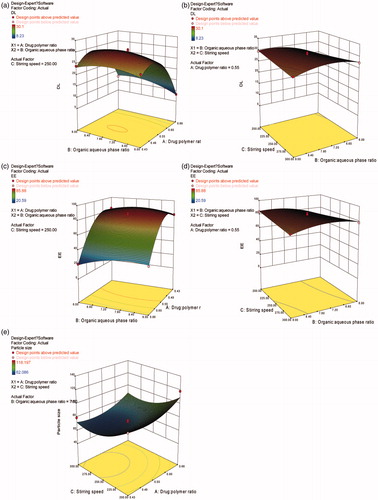
Figure 3. (a) The in vitro release profile of RM from microspheres prepared by W/O/W double emulsion–solvent evaporation method (MS-B) and W/O/O emulsion-phase separation method with the drug loading of 7.20% (MS-E1), 17.34% (MS-E2), 26.42% (MS-E3) and 30.12% (MS-optimal formulation). (b) and (c) The effect of solvent type and volume in gel matrix solution on the in vitro release of RM-microsphere-Gel in situ forming implant, 15% EtOH (S1), 20% EtOH (S2), 25% EtOH (S3), 25% NMP (S4), 30% NMP (S5), 40% NMP (S6). (d) The in vitro release profile of RM from in situ gel with the solvent of 15% EtOH (S7) and 25% NMP (S8). Graphs symbolize mean ± SD. (n = 3).
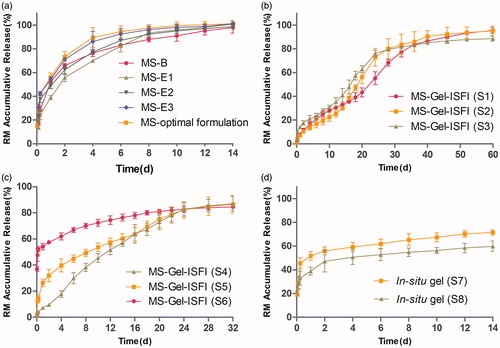
Figure 4. Mean plasma concentration-time curve of RM-microspheres with the optimal formulation, RM–in situ gel (gel matrix composed of 85% SAIB and 15% EtOH) with the drug loading of 30 mg/mL and RM–microsphere–Gel in situ forming implant (gel matrix composed of 85% SAIB and 15% EtOH) with the drug loading of 30 mg/mL after single-dose intramuscular injection of 5.6 mg/kg to rats (mean ± SD, n = 5).
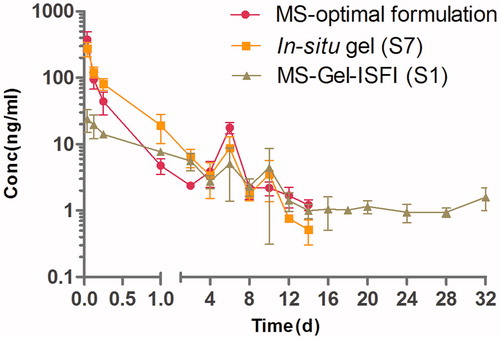
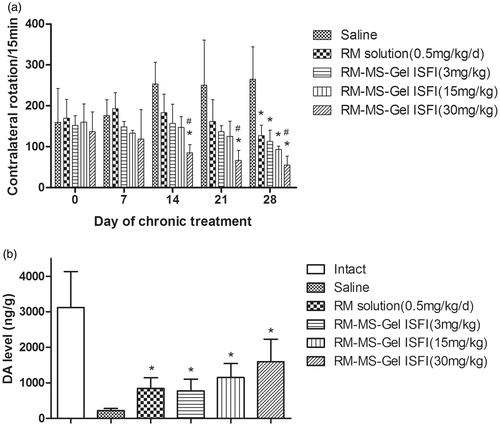
Figure 5. Effect of chronic treatment with RM–microsphere–Gel in situ forming implant on 6-hydroxydopamine-lesioned rats. (a) Rotational response to apomorphine expressed as number of contralateral rotations per 15 min in animals treated with saline and RM solution at 0.5 mg/kg/d (i.m.), and RM–microsphere–Gel in situ forming implant at a single-dose of 3, 15 and 30 mg/kg (i.m.). (b) Striatal DA level (ng/g wet weight of tissue) in intact side and lesioned side treated with saline, RM solution at 0.5 mg/kg/d, and RM–microsphere–Gel in situ forming implant at 3, 15 and 30 mg/kg after 28 days. Data shown are mean ± SD, (n = 5). *p < .05 for significant different from saline group and #p < .05 for significant different from RM solution group using one-way ANOVA followed by the Bonferroni test.