Figures & data
Figure 1. Schematic representation of the rough PTX-PLGA-MS fabrication technique, tumor site injection and intracellular drug delivery pathway. Intracellular trafficking includes enhanced PTX uptake through adsorptive endocytosis, sustained PTX release, and promoted microtubule assembly and stabilization. The dysregulation of cell cycle progression includes arresting the G2/M cell phase and disturbing microtubules dynamic equilibrium.
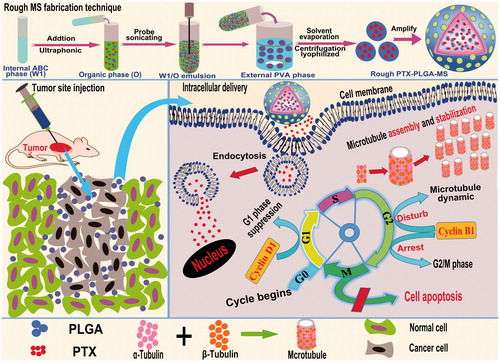
Figure 2. The surface and internal SEM micrographs of (A) smooth PTX-PLGA-MS and (B) rough PTX-PLGA-MS; (C) The fractured internal morphology of rough PTX-PLGA-MS. The arrows represent the PTX drug substances; and (D): The 3 D outer and inner morphometric of rough PTX-PLGA-MS.
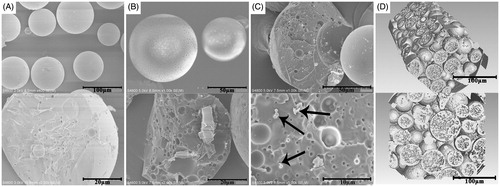
Figure 3. (A) In vitro cumulative released curves of free PTX, smooth, and rough PTX-PLGA-MS. SEM micrographs of rough PTX-PLGA-MS after incubation in the release medium for (B) three, (C) seven, and (D) 14 days. The stars mark the PTX crystals on the mesopores of MS.
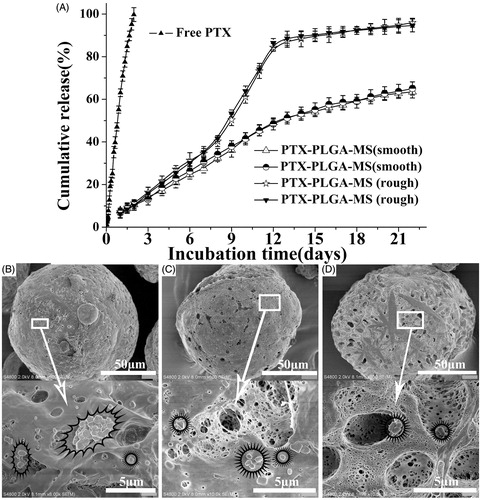
Figure 4. Apoptosis analysis of U251 cells induced by (A) free PTX and (B) rough PTX-PLGA-MS with different concentrations of PTX (25, 5, 1, and 0.2 μg/mL, respectively) for 48 h using flow cytometry. (C) The bar graphs show the percentage of cell apoptosis with different treatments. △, # vs. control group, △, *,#p < .05, and △△, ##p < .02.
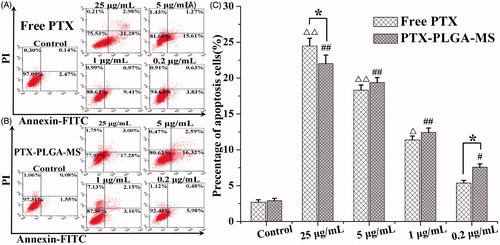
Figure 5. In vivo antitumor efficacies of saline, free PTX, empty PLGA-MS, rough, and smooth PTX-PLGA-MS in tumor-bearing nude mice (n = 7). (A) Tumor growth curves during the entire experiment. (B) Body weight variations of mice. Photographs of (C) excised tumors and (D) tumor-bearing nude mice at the end of the treatment procedure. (E) Weights of excised tumor at the end of the tests. (F) The histological characteristics of liver tumor tissue after treatments. # vs. control group, *, # p < .05; **, ##p < .02; and ***p < .01.
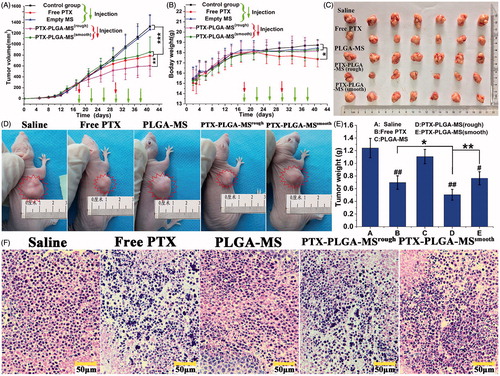
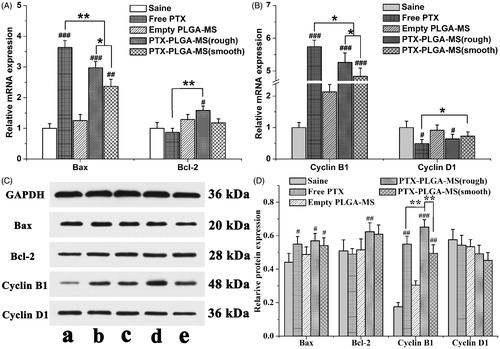
Figure 6. Molecular biological analysis of liver tumors receiving different treatments. Relative (A) Bax/Bcl-2 and (B) Cyclin B1/Cyclin D1 mRNA expression changes in liver tumors were analyzed by PCR. GAPDH was used as an internal reference. (C) Effects of saline, free PTX, empty PLGA-MS,) rough PTX-PLGA-MS, and smooth PTX-PLGA-MS on proteins expression in liver tumors. (D) Quantitative evaluation on proteins expression were further analyzed by densitometry. # vs. saline group; *, #p < .05; **, ##p < .02; and ###p < .01.