
Figures & data
Figure 1. Schematic illustration of the preparation of the FA-Gd-Au PENPs.
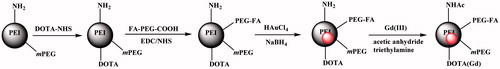
Figure 2. TEM image (a) and size distribution histogram (b) of the FA-Gd-Au PENPs. Inset of (a) is the high-resolution TEM image of a typical FA-Gd-Au PENP. (c) MTT assay of HeLa cell viability after treatment with the FA-Gd-Au PENPs at different Au concentrations for 24 h. Data are reported as mean ± SD (n = 3). (d) Cellular Au uptake in HeLa cells incubated with the FA-Gd-Au PENPs and nontargeted Gd-Au PENPs with different Au concentrations for 3 h.
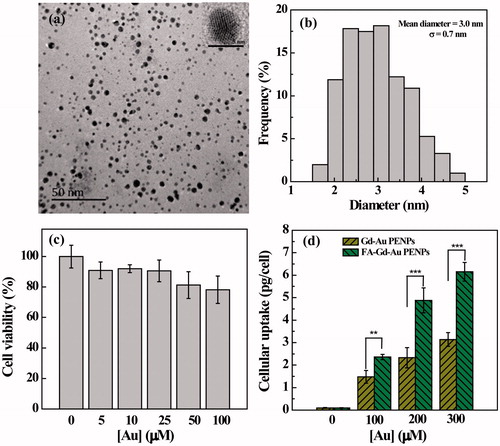
Figure 3. Confocal microscopic images of HeLa cells treated with the FA-Gd-Au PENPs and nontargeted Gd-Au PENPs ([Au] = 100 μM) for 12 h. The white frame refers to the cytophagic particles.
![Figure 3. Confocal microscopic images of HeLa cells treated with the FA-Gd-Au PENPs and nontargeted Gd-Au PENPs ([Au] = 100 μM) for 12 h. The white frame refers to the cytophagic particles.](/cms/asset/88cc42c8-1c80-441e-bd1a-acbceb089847/idrd_a_1422299_f0003_c.jpg)
Figure 4. (a) CT phantom images and (c) X-ray attenuation intensity of the FA-Gd-Au PENPs and Omnipaque as a function of the molar concentration of the radiodense element (Au or iodine). (b) and (d) show the T1-weighted MR phantom images and the linear fitting of the inverse T1 of the FA-Gd-Au PENPs as a function of Gd concentration.
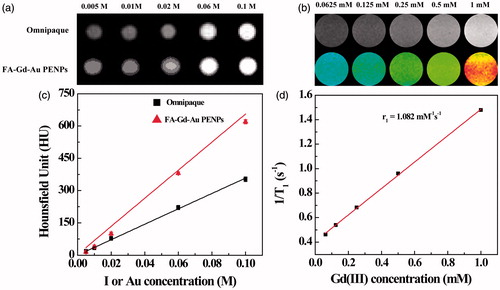
Figure 5. In vivo CT images (including renderings) (a) and CT values (b) of tumors at different time points post-injection of the FA-Gd-Au PENPs and nontargeted Gd-Au PENPs ([Au] = 0.1 M, 150 μL in PBS for each mouse). The circle in each panel refers to the tumors site.
![Figure 5. In vivo CT images (including renderings) (a) and CT values (b) of tumors at different time points post-injection of the FA-Gd-Au PENPs and nontargeted Gd-Au PENPs ([Au] = 0.1 M, 150 μL in PBS for each mouse). The circle in each panel refers to the tumors site.](/cms/asset/5acc9247-e897-4da5-93a4-45daea9add03/idrd_a_1422299_f0005_c.jpg)
Figure 6. In vivo T1-weighted MR images (including pseudo-color images) (a) and tumor signal enhancement percentage (b) of nude mice before and at different time points post-injection of the FA-Gd-Au PENPs and nontargeted Gd-Au PENPs ([Gd] = 0.01 M, 150 μL in PBS for each mouse). The circle in each panel refers to the tumor site.
![Figure 6. In vivo T1-weighted MR images (including pseudo-color images) (a) and tumor signal enhancement percentage (b) of nude mice before and at different time points post-injection of the FA-Gd-Au PENPs and nontargeted Gd-Au PENPs ([Gd] = 0.01 M, 150 μL in PBS for each mouse). The circle in each panel refers to the tumor site.](/cms/asset/5c5ce092-ffb1-49bd-a5c2-4dcca56f0b3b/idrd_a_1422299_f0006_c.jpg)