Figures & data
Figure 1. Synthesis of Apt-CNBs, characterization of Apt-CNBs, siFoxM1-loaded NBs, RNase protection, US sensitivity, target binding in vitro. (A) DiI-labeled carboxyl-modified CNBs (red), FAM-labeled amine-modified A10-3.2 aptamer (green) by covalently coupling reaction, overlapping the A10-3.2 aptamer using the CNBs emerging as yellow fluorescence in the mixed channel. (B) (a, b) Zeta potential and size distribution of the Apt-CNBs was determined by DLC. (c, d) LCSM and TEM image of DiI-labeled-Apt-CNBs. (C) The dose-dependent relationship between the FoxM1 siRNA and NBs. The loading capacity of the Apt-CNBs and CNBs with FoxM1 siRNA were significantly higher than the NNBs, **p < .01, ***p < .001, compared with NNBs. (D) FoxM1 siRNA via agarose gel electrophoresis. (1) siFoxM1-Apt-CNBs RNase (+) group, (2) siFoxM1-Apt-CNBs RNase (–) group, (3) naked FoxM1 siRNA RNase (+) group, (4) naked FoxM1 siRNA RNase (–) group. (E) Fluorescence imaging, together with the FCM, was put to use for evaluating the targeting efficacy of varied developments of siFoxM1-NBs to PSMA-positive LNCaP cells as well as PSMA-negative PC3 cells. Blue (DAPI) is a representation of cell nuclei, green (DiO) reveals the cytomembrane, whereas the red (DiI) dots imply DiI-labeled siFoxM1-NBs. (F) The US sensitivity of siFoxM1-Apt-CNBs did not change compared with that of siFoxM1-CNBs, siFoxM1-NNBs and SonoVue before and after low-frequency US destruction. n = 3; Scale bars =500 nm, 10 μm, or 20 μm.
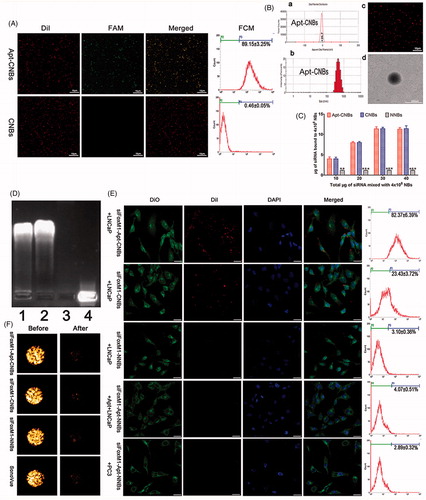
Figure 2. Transfection efficiency, cell apoptosis and cycle, cell viability, gene silencing efficiency of siFoxM1-Apt-CNBs in vitro. (A) Detection of the intracellular localization of Cy3-siRNA and measurement of the transfection efficiency through CLSM and flow cytometry, respectively. Blue (DAPI) is a representation of cell nuclei, green (DiO) reveals the cytomembrane, whereas the red (Cy3) dots imply Cy3-labeled FoxM1NCsiRNA. (B, C) The apoptotic and cycle of LNCaP cells were detected by flow cytometric after transfection for 48 h. (D, E) Quantitative flow cytometric analysis of the percentage of cell apoptotic and cell cycle changes after transfection for 48 h, *p < .05, **p < .01, compared with siFoxM1-Apt-CNBs groups, n = 3. (F) LNCaP cell viability was measured with CCK-8 after transfection treatment for 48 hours. (G, J, and K) The FoxM1, E-cadherin protein expression levels were detected by western blotting after 48 hours of transfection treatment. (H, I) The FoxM1 and E-cadherin mRNA expression levels were evaluated by RT-PCR after 48 hours of transfection treatment. #p < .05, *p < .05 compared with the control, siFoxM1-NNBs and siFoxM1-Apt-CNBs groups; ##p < .01, **p < .01 compared with the control and siFoxM1-NNBs groups, n = 3; Scale bars =20 μm.
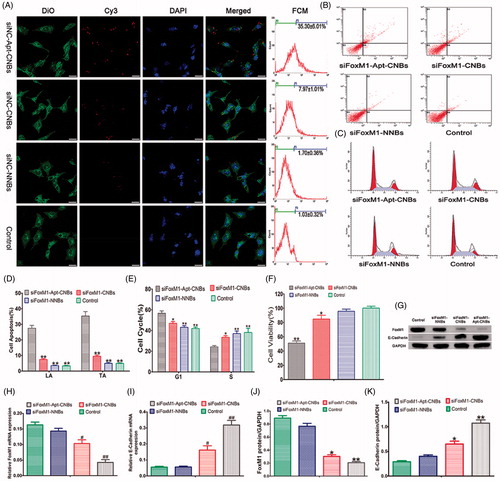
Figure 3. Fluorescence imaging and bio-distribution in the xenograft tumors (A) variations that happen in the fluorescence intensity of DiR-labeled siFoxM1-Apt-CNBs, siFoxM1-CNBs, and siFoxM1-NNBs in xenograft tumors in nude mice at the time intervals of 0, 5, 10, 15, and 30 min. (B) Biodistribution of DiI-labeled siFoxM1-Apt-CNBs, siFoxM1-CNBs, and siFoxM1-NNBs in the cryosections of varied organ tissues by LCSM. Blue (DAPI) is a representation of cell nuclei, whereas the red (DiI) dots imply DiI-labeled siFoxM1-NBs. Scale bars =20 μm.
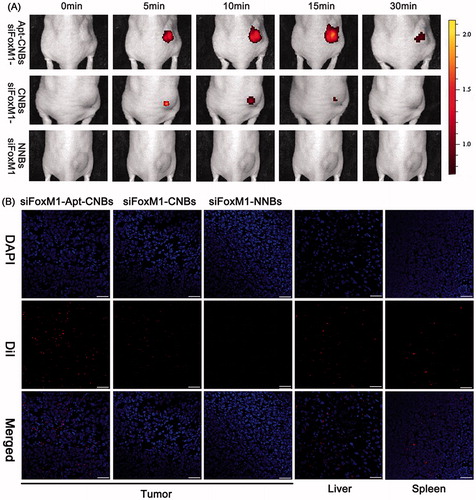
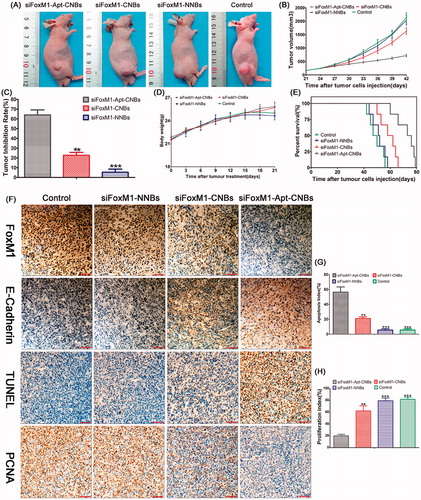
Figure 4. Therapeutic effect of siFoxM1-NBs combined with UMND in vivo. (A) Tumor volume in the various treatment groups. (B) Tumor growth curve in the various treatment groups. (C) Tumor inhibition rate in the various treatment groups. (D) Changes in the body weight in the various treatment groups. (E) Cumulative survival outcome of the LNCaP tumor-bearing nude mice in the various treatment groups. (F) Immunohistochemistry, TUNEL, and PCNA assay analyses of tumor tissue section from xenograft-bearing mice receiving different treatment after 21 days treatment. Analysis of immunohistochemical assays, brown staining indicates the positive expression of FoxM1, E-cadherin in tumor tissue, and the blue staining indicates the cell nuclei, respectively. Analysis of TUNEL and PCNA assays, brown staining the cell nuclei indicates the apoptosis- and proliferation-positive tumor cells, whereas blue staining the cell nuclei indicates the apoptosis- and proliferation-negative tumor cells. (G, H) Apoptosis and proliferation index of the various treatment groups, **p < .01, ***p < .001, compared with siFoxM1-Apt-CNBs group; scale bars =50 μm.