
Figures & data
Figure 1. Formation scheme and transmission electron micrographs of CuB-MMs-CPs.
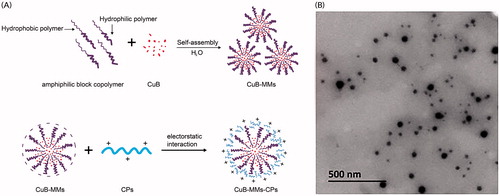
Figure 2. Optimization of CPs, cytotoxicity and uptake evaluation of CuB and CuB-MMs-CPs. The effects of CPs’ different molecular weight and quantity on Caco-2 intaking of CuB (A). Changes of amino acid ratio between before and after the separation of CPs (B). CuB release profiles from the micelles in vitro (C). Cytotoxicity of blank MMs-CPs, CuB, CuB-MMs, and CuB-MMs-CPs against HepG -2 cells (D, n = 3). Cellular uptake efficiency of the CuB, CuB-MMs, and CuB-MMs-CPs micelles by Caco-2 cells in different concentrations (12.5 μg/mL, 25 μg/mL, 50 μg/mL, 100 μg/mL, 200 μg/mL) or after 0.5 h, 1 h, 1.5 h, and 2 h incubation (E).
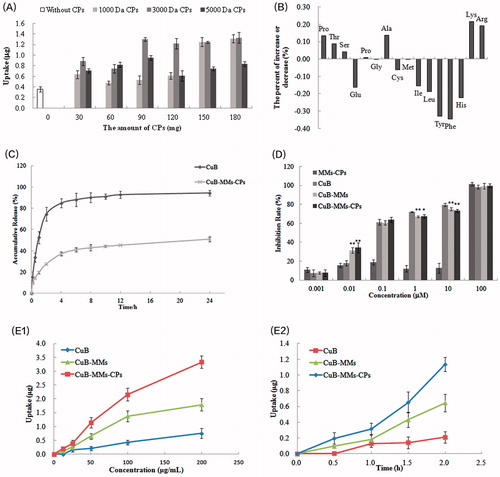
Table 1. Particle size and potential of CuB-MMs-CPs-complexed micelles with different amount of CPs (n = 3).
Figure 3. Transcellular transportation evaluation of CuB and CuB-MMs-CPs across the Caco-2 cell monolayer. The cumulative transport flux and transport rate of CuB and CuB-MMs-CPs from AP to BL and BL to AP (A and D). Effects of temperature on the transportation quantity of CuB and CuB-MMs-CPs across Caco-2 cell monolayers from AP to BL and BL to AP were investigated (B and E). The effect of efflux pump, ATP, and endocytosis inhibitors on the transportation of CuB and CuB-MMS-CPs were assayed (C and F).
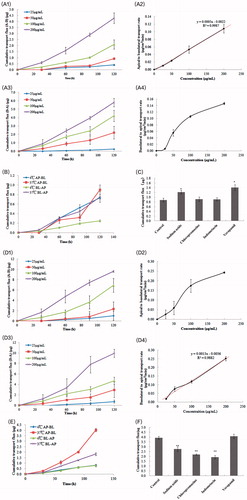
Figure 4. Time–concentration curve for CuD after oral administration of Cucurbitacin B, CuB-MMs, and CuBMMs-CPs (A) and in vivo antitumor study of normal saline, CuB, and CuB-MMs-CPs in Balb/c nude mice implanted with HepG-2 cells. Tumor volumes (B) and body weight (C) were monitored. Tumor weight was monitored at the end of the experiment (D). The result was presented as the mean ± SD (n = 6).
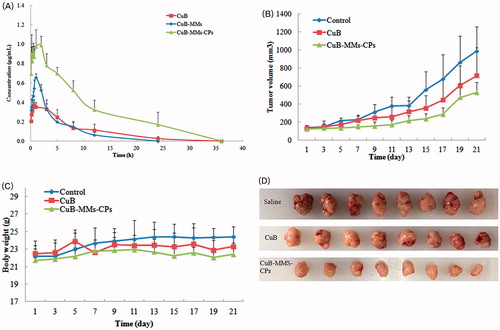
Table 2. Pharmacokinetic parameters of CuD after oral administration of CuB, CuB-MMs, and CuB-MMs-CPs (n = 6).