Figures & data
Scheme 1. The schematic diagram of simultaneous targeting therapy for lung metastasis and breast tumor.
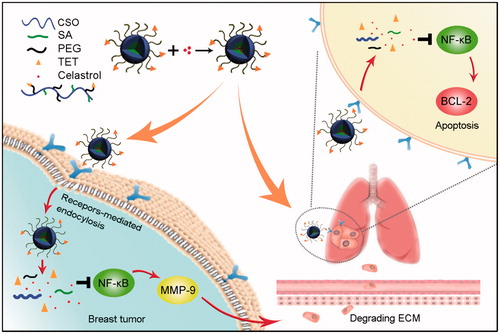
Figure 1. Synthesis route, 1 H NMR spectra, and characterization of TET-CSOSA micelles. (A) Synthetic route of TET-CSOSA. (B) 1 H NMR spectra of NH2-PEG2000-NH2, TET, CSOSA, and TET-CSOSA. The representative peaks were pointed out and magnified (upper). (C) TEM images of the CSOSA/Cela and TET-CSOSA/Cela micelles.
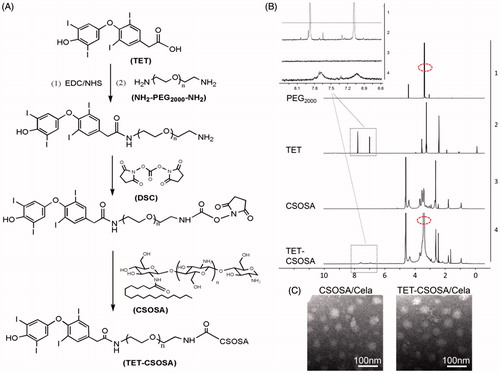
Figure 2. Fluorescence analysis of the cellular uptake and competition assay of TET- CSOSA in 4T1 and MDA-MB-231 cells. (A) Confocal laser scanning microscopy images of the cellular uptake of FITC labeled CSOSA and TET-CSOSA for 2, 4, and 8 h. All scale bars represent 50 μm. (B) Quantitative evaluation of the cellular uptake based on flow cytometry. (C) In vitro competition assay for detecting the targeting of TET-CSOSA to αvβ3 in 4T1 and MDA-MB-231 cells. Cells were preincubated with 0μ, 20, 40, and 80 μΜ of TET, respectively. Fluorescence signals were observed by flow cytometry.
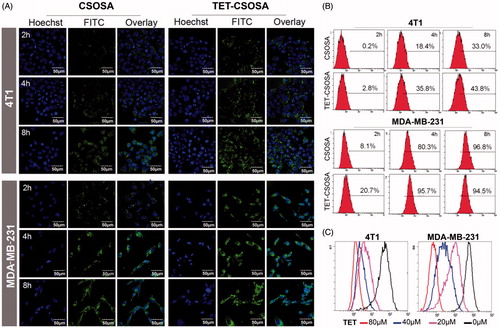
Figure 3. In vitro apoptosis and anti-metastasis effects of different formulations against 4T1 and MDA-MB-231 cells. Optical images of cells migration, (A) invasion, (B) and wound edge (C) after incubation for 12 h with 0.5 µg/mL of Celastrol, CSOSA/Cela, and TET-CSOSA/Cela. (D) Inhibition for the tube formation in HUVECs cells (bar =200 µm). (E) Apoptosis of Celastrol and Celastrol loaded micelles in 4T1 and MDA-MB-231 cells tested by Annexin V and analyzed by flow cytometry respectively. (F) The expression levels of NF-κB, MMP-9, and Bcl-2 in 4T1 cells were detected by Western blot.
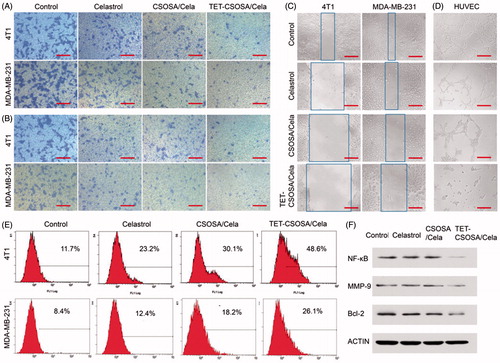
Figure 4. In vivo simultaneous distribution in 4T1 metastasis model. In vivo targeting of CSOSA/DiR and TET-CSOSA/DiR to breast 4T1 tumor (A), dissected tumors and organs, (B) and quantification of the mean fluorescent intensity (C) after 48 h of injection (n = 3). (D) Fluorescence imaging of the dissected lungs after CSOSA/DiR and TET-CSOSA/DiR treatment in the 4T1 lung metastasis tumor bearing mice. ***p < .001.
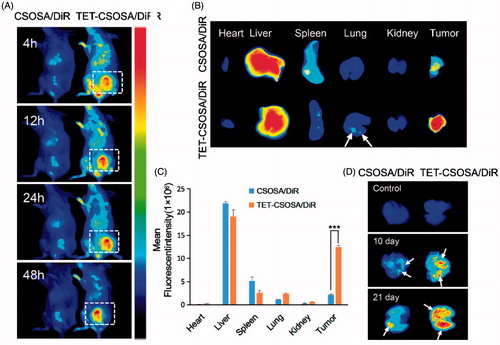
Figure 5. Therapeutic effects on 4T1 breast primary tumor bearing mice after intravenous administration with different formulations at a drug dose of 2 mg/kg. Images of the excised tumors at the end of the tests: dissected tumors weight (A), tumor weight-time graph (B), body weight-time graph (C), and tumor volume-time graph (D) during the treatment (n = 5). (E) Histopathological examination of E-cad, CD31, and MMP-9 for breast tumor separated from saline, Celastrol, CSOSA/Cela, and TET-CSOSA/Cela mice at the end of experiment. **p < .01;***p < .001.
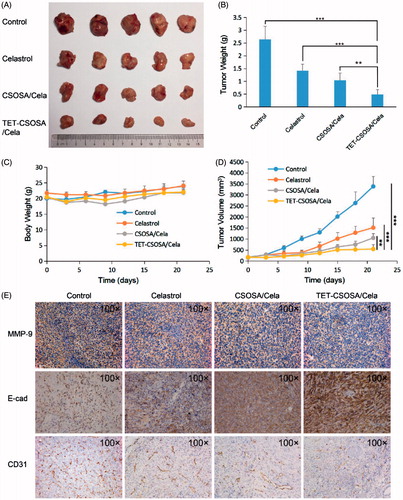
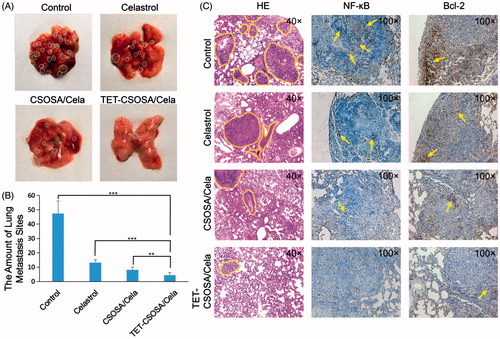
Figure 6. In vivo anti-metastasis experiment. (A) The photograph of metastasis sites in the lungs. (B) The amount of breast lung metastasis sites in 21 days (n = 5, mean ± SD). (C) Photos of the statistical analysis of metastasis sites on the lungs and histopathologic examination of NF-κB and Bcl-2 in mice lung metastasis at the end of treatment. **p < .01; ***p < .001.