Figures & data
Scheme 1. Rational design and synthesis of different-sized MSN nanosystems to enhance the anticancer activity and suppress cancer multidrug resistance.
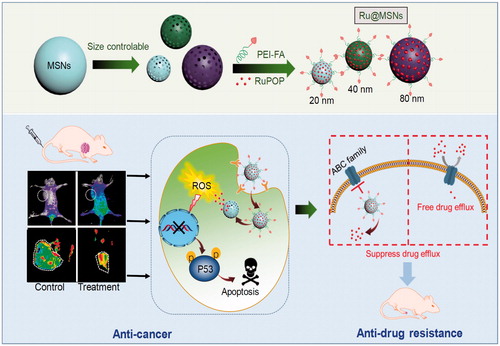
Figure 1. Morphology and structural characterization of different-sized MSNs. (a) TEM images of the different-sized MSNs (scale =200 nm). (b) Sizes distribution of the different-sized MSNs. (c) Zeta potential for three different-sized MSNs and Ru@MSNs nanosystems. (d) Nitrogen adsorption and desorption isotherms for the different-sized MSNs. (e) Pore sizes distribution for the different-sized MSNs. (f) UV and (g) fluorescence spectra of RuPOP and Ru@MSNs. (h) RuPOP loading efficiency in the three different-sized MSNs nanosystems. Values expressed were mean ± standard deviation of triplicates. Value represents means ± SD (n = 3).
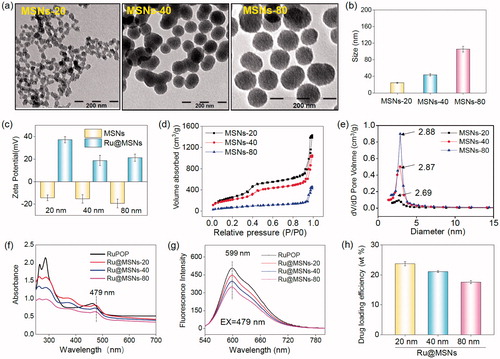
Figure 2. Anticancer activity and the selective cellular uptake of Ru@MSNs in vitro. The drug concentration in all biological studies was calculated as RuPOP by ICP-MS analysis. (a) IC50 for the RuPOP and different-sized Ru@MSNs toward HepG2 tumor cells and L02 normal cells. Cellular uptake of different-sized Ru@MSNs in HepG2 (b) and L02 (c) cells for 4 and 8 h. Cells were treated with 1 μM of different-sized Ru@MSNs and free RuPOP. (d) Localization of the different-sized Ru@MSNs (red) in HepG2 cells. The cells were treated with 1 μM of Ru@MSNs. (e), (f), and (g) in vitro drug release for the different-sized Ru@MSNs in PBS at pH =7.4 and cells lysate. The scale bar is 20 μm. Value represents means ± SD (n = 3).
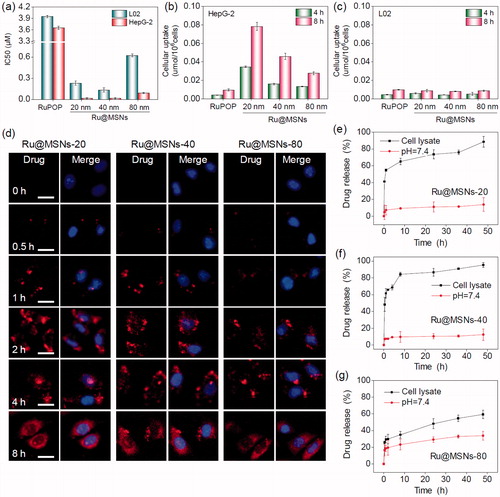
Figure 3. (a) Flow cytometric analysis of HepG2 cells (2 × 10⁴ cells/mL) exposed with 0.2 μM of different-sized Ru@MSNs for 24 h. (b) ROS overproduction in HepG2 cells (2 × 10⁵ cells/mL) exposed to RuPOP and Ru@MSNs (1 μM) for 2 h. (c) Immunofluorescence of phosphorylated p53 in HepG2 cells with different-sized Ru@MSNs and free RuPOP at 1 μM. The scale bar is 20 μm. Value represents means ± SD (n = 3). (d) Activation of p53 signal pathway in HepG2 cells exposed to different-sized Ru@MSNs. (e) Fluorescence imaging monitor the accumulation and distribution of the different-sized Ru@MSNs in HepG2 xenograft nude mice at 72 h. The treated concentration was 0.2 mg/kg of Ru@MSNs. (f) Fluorescence imaging of the main organs in 72 h-treatment with Ru@MSNs and free RuPOP.
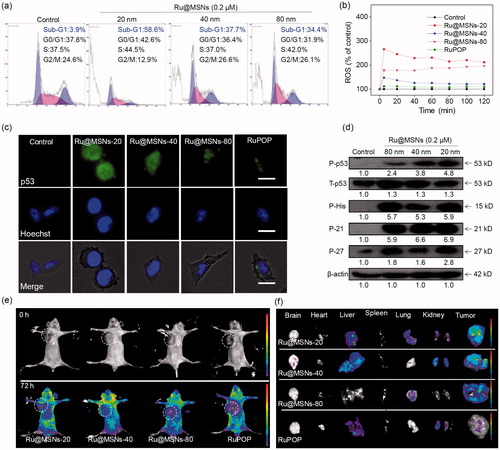
Figure 4. In vivo therapeutic effects of different-sized Ru@MSNs in HepG2 tumor-bearing mice. Changes in the tumor volume (a), tumor weight (b), and body weight (c) after treating with different-sized Ru@MSNs and free RuPOP at 0.2 mg/kg for 21 d. (d) H&E staining in tumor xenografts after treated with different-sized Ru@MSNs and free RuPOP. The scale bar is 100 μm. T2 weighted MRI (e) and pseudo color slow ADC (f) of HepG-2 tumor tissues after 10 and 21 d-treatment with different-sized Ru@MSNs and free RuPOP at 0.2 mg/kg. The tumor sites are in the back region and circled by dashed lines. Value represents means ± SD (n = 3).
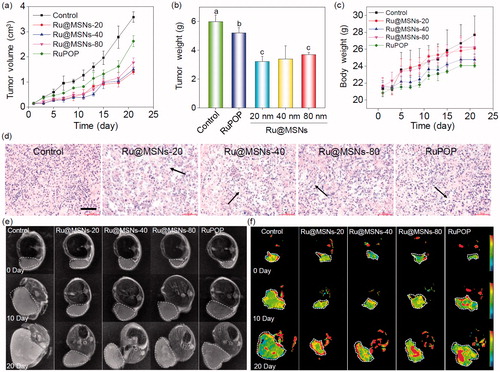
Figure 5. (a) The toxicity of the different-sized Ru@MSNs and RuPOP at 0.2 mg/kg on major organs after 21 d treatment. The scale bar is 100 μm. (b) Hematological analysis of healthy and tumor-bearing nude mice, and the treatment group of different-sized Ru@MSNs and RuPOP for 21 d. Value represents means ± SD (n = 3).
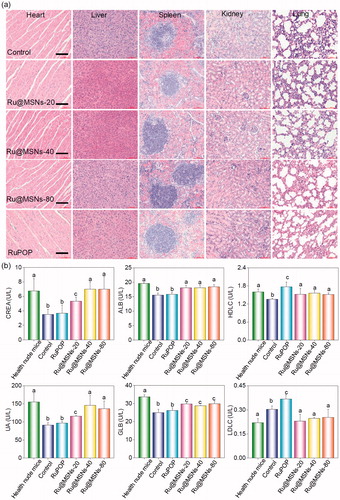
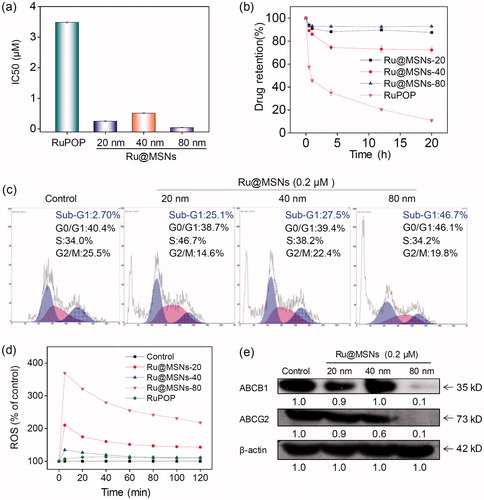
Figure 6. Anti-drug resistance of different-sized Ru@MSNs nanosystems through suppressing drug efflux. (a) IC50 for the RuPOP and different-sized Ru@MSNs toward the drug resistance cells of R-HepG2. (b) Quantitative analysis of drug retention for the different-sized Ru@MSNs in R-HepG2 cells. (c) Flow cytometric analysis of R-HepG2 cells exposed with 0.2 μM of different-sized Ru@MSNs for 24 h. (d) ROS overproduction in R-HepG2 cells exposed to RuPOP and Ru@MSNs. (e) Inhibition of ABC family by Ru@MSNs. Value represents means ± SD (n = 3).