Figures & data
Scheme 1. Schematic illustrations of the synthetic procedures for Gd/CeO2-ZrO2/DOX-PEG and their corresponding application.
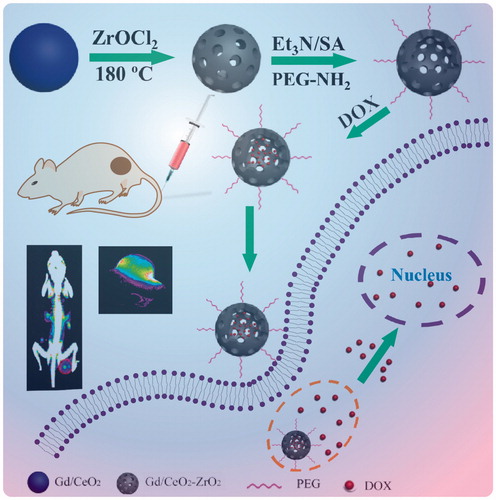
Figure 1. Structure characterizations of Gd/CeO2-ZrO2/DOX-PEG. TEM image of Gd/CeO2 (A), Gd/CeO2-ZrO2 (B), Gd/CeO2-ZrO2-PEG (C), Gd/CeO2-ZrO2/DOX-PEG (D); DLS particle size distribution of Gd/CeO2, Gd/CeO2-ZrO2, Gd/CeO2-ZrO2-PEG and Gd/CeO2-ZrO2/DOX-PEG (E); FT-IR spectra of Gd/CeO2-ZrO2, Gd/CeO2-ZrO2-PEG and PEG-NH2 (F); The zeta potential of Gd/CeO2-ZrO2, Gd/CeO2-ZrO2-COOH, Gd/CeO2-ZrO2-PEG and Gd/CeO2-ZrO2/DOX-PEG (G).
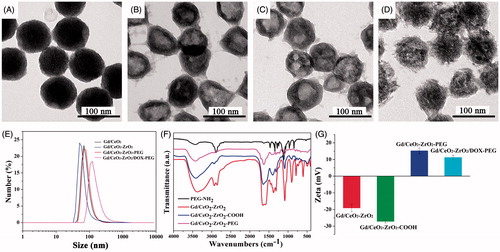
Figure 2. UV-vis spectra of free DOX solution, Gd/CeO2-ZrO2-PEG and Gd/CeO2-ZrO2/DOX-PEG (A); in vitro release of DOX from Gd/CeO2-ZrO2-PEG at different pH (B); T1-weighted and color-mapped magnetic resonance (MR) images for various Gd3+ concentrations and relaxation rate r1 (1/T1) versus different Gd3+ concentrations of Gd/CeO2-ZrO2/DOX-PEG (inset: T1-weighted and color-mapped magnetic resonance (MR) images for various Gd3+ concentrations) (C); CT value versus different Zr4+ concentrations of Gd/CeO2-ZrO2/DOX-PEG (inset: CT images and color-mapped images for various Zr4+ concentrations) (D).
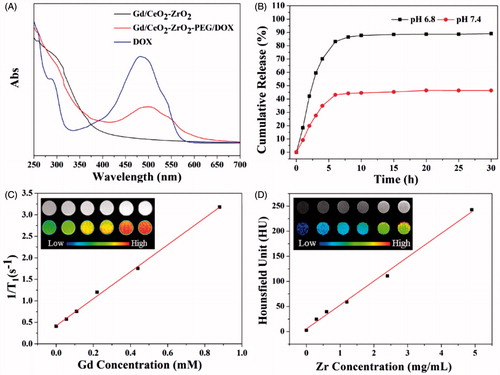
Figure 3. Intracellular uptake Gd/CeO2-ZrO2/DOX-PEG and DOX release at different incubation time (A); Cell viability of HepG-2 cells treated with different concentration of Gd/CeO2-ZrO2-PEG (B), Free DOX and Gd/CeO2-ZrO2/DOX-PEG (C) for 48 h; Fuorescence microscopic images of HepG-2 cells stained by the LIVE/DEAD Cell Vitality Assay Kit with different concentrations of Gd/CeO2-ZrO2/DOX-PEG for 48 h (D); Flow cytometry analysis of HepG-2 cell apoptosis induced by different concentrations of Gd/CeO2-ZrO2/DOX-PEG for 48 h as indicated using Annexin V-FITC/PI apoptosis detection assay (E).
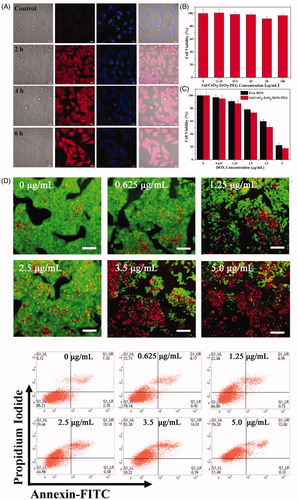
Figure 4. Serum biological parameters of liver (A) and kidney (B) obtained from mice at 7 days after being exposed to Gd/CeO2-ZrO2-PEG (n = 5), or PBS solution (n = 5, control); hematoxylin and eosin (H&E)-stained tissue sections from mice at 7 days after injected with Gd/CeO2-ZrO2-PEG (n = 5), or PBS solution (n = 5, control). Tissues were harvested from heart, liver, spleen, lung and kidney (C).
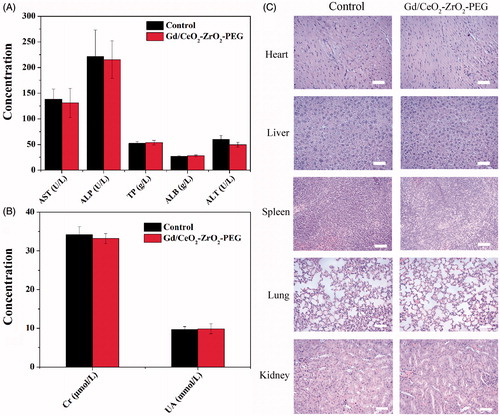
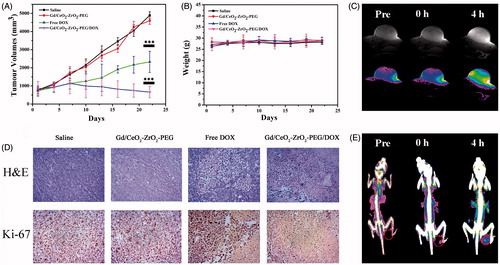
Figure 5. Growth curves of tumors in the mice after chemotherapy treatments (*p < .05, **p < .01, ***p < .001; n = 5) (A); relative body weight change of mice in different groups after treatment (n = 5) (B); corresponding H&E and Immunohistochemical staining of the tumor tissues after 22 d treatment as indicated (C); T1-weighted MR images of tumor acquired at different time intervals post injection of Gd/CeO2-ZrO2/DOX-PEG (D); CT images of tumor acquired at different time intervals post injection of Gd/CeO2-ZrO2/DOX-PEG (E).