Figures & data
Figure 1. Hypothesis of establishing HSA co-deliver three anticancer agent based on the nature of HSA and agents.
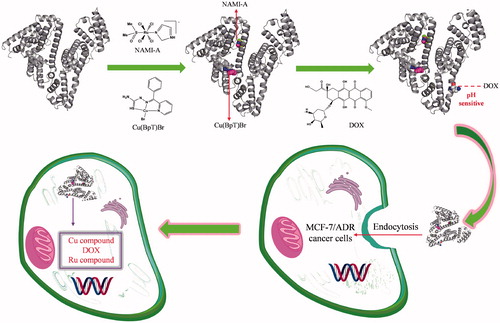
Figure 2. (A) and (B) Experimental sigmaA weighted 2Fo-Fc electron density map of Ru and Cu compounds at IB subdomain and IIA subdomain of HSA, respectively. (C) and (D) Structural binding environment of Ru and Cu compounds at IB subdomain and IIA subdomain of HSA, respectively. The amino acid chains that are close to the drug molecules are shown as sticks.
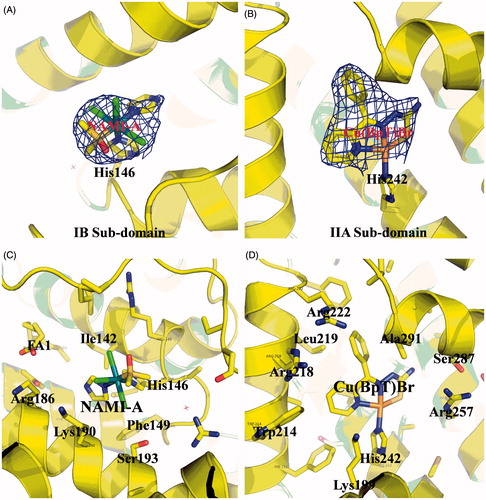
Figure 3. (A) The MALDI-TOF-MS spectrum of HSA and HSA complexes. (B) The model of HSA–NAMI-A–Cu(BpT)Br–DOX complex.
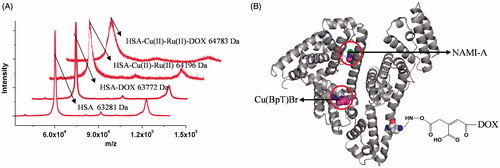
Figure 4. (A) The profiles of DOX or NAMI-A or Cu(BpT)Br release from HSA–NAMI-A–Cu(BpT)Br-DOX complex at different pH (citric-phosphate buffer). Results are the mean ± SD (n = 3): **p < .01. (B) Fluorescence microscope images of MCF-7/ADR cells. MCF-7/ADR cells treated with 10 μM three-agent combination (NAMI-A/Cu(BpT)Br/DOX) and 10 μM HSA–NAMI-A–Cu(BpT)Br–DOX complex for 5 h, respectively.
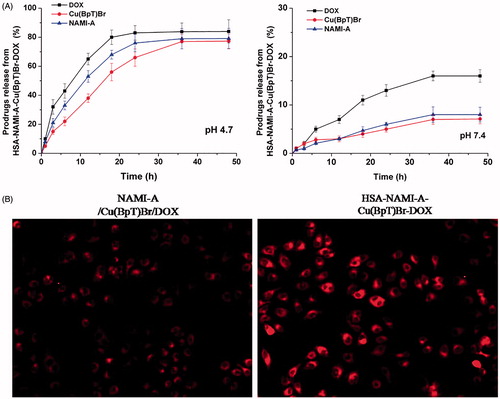
Table 1. Inhibition of human cancer cell lines growth (IC50, μM) for agent, agents combination and HSA–NAMI-A–Cu(BpT)Br–DOX complex.
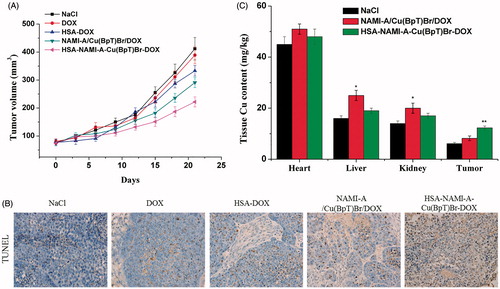
Figure 5. In vivo anti-tumor activity of HSA–NAMI-A–Cu(BpT)Br–DOX, three-drug combination, HSA-DOX, free DOX, and NaCl (n = 6). (A) Tumor volumes of MCF-7/ADR-bearing mice as a function of time. (B) Apoptotic cells were evaluated in tumor tissue using a TUNEL assay. (C) Tissue copper of MCF-7/ADR tumor-bearing nude mice after treatment with saline, three-drug combination and HSA–NAMI-A–Cu(BpT)Br–DOX. Results are the mean ± SD (n = 3): *p < .05; **p < .01.