Figures & data
Figure 1. Encapsulated QX-314 delivered intracellularly gradually suppresses neuronal excitability in vitro. (A) A snapshot showing the suspension of nano-engineered microcapsules (magnified on the right), with encapsulated Alexa Fluor 488; confocal imaging (λx= 488 nm). (B) Monitoring gradual release of encapsulated Alexa Fluor 488 from microcapsules; ordinate, time course of average capsule fluorescence normalized to the initial value; solid line, best-fit bi-exponential approximation (with 0.04 and 0.96 partial weights, respectively; decay constants as shown; n = 1.6 × 10⁸ microcapsules). (C) Snapshots displaying the patch pipette tip filled with microcapsules (TRITC fluorescence) prior to patching (left), when targeting a cultured neuron (middle), and in whole-cell configuration 25 min following intracellular delivery of microcapsules (right; DIC + fluorescence images of the same cell). (D) Traces, examples of current-clamp recordings of neuronal firing in control condition and after injection of encapsulated QX-314 (immediately after breaking-in and 20 min later, as indicated). Graph, statistical summary: time course of the maximal neuronal firing rate in control cells (no microcapsules; n = 17), with empty microcapsules injected (n = 12), encapsulated QX-314 injected (n = 18), with non-capsulated QX-314 injected at 0.5 mM (n = 6) and 5 mM (n = 4), as indicated. (E) Left, examples of neuronal firing in response to a slow-ramp current after infusion of encapsulated QX-314 (left, 0 and 20 min post-injection in the same cell; dotted boxes indicate first spikes selected for comparisons); right, example of single AP evoked in hippocampal neurons, with the estimated parameters indicated (FWHM, full width at half maximum). (F) Time course of the relative spike amplitude (left) and the spike overshoot (amplitude above 0 mV; right) in control condition (no capsules, black dots) and after intracellular delivery of encapsulated QX-314 (red dots), as indicated; spike sampling as shown in panel E (left); control, n = 9 neurons; encapsulated QX-314, n = 9 neurons. All data are shown as mean ± SEM. **p < .01, ***p < .001 (unpaired t-test).
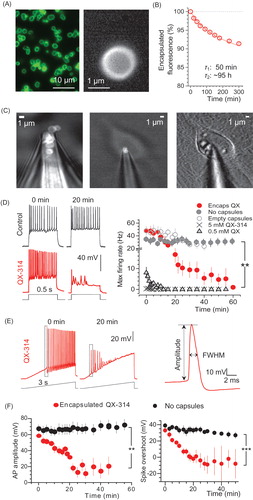
Figure 2. Encapsulated QX-314 gradually increases cell input resistance of neurons while reducing their firing rate in a dose-dependent manner. (A) Traces, examples of the membrane potential response (top) to current step pulses (bottom) in the same neuron (control condition, no microcapsules) at two time points, as indicated. Dashed lines, time window (stable response) where the input resistance was estimated. Graph, examples of the current–voltage relationship at three time points, as indicated, in control conditions. (B) Examples of the current–voltage relationship at three time points, as indicated, after the injection of empty microcapsules. (C) Traces, examples of the membrane potential response (top) to a current injection (bottom) at three time points after intracellular delivery of encapsulated QX-314, as indicated. Graph, examples of the current–voltage relationship at three time points, as indicated, for the same cell. (D) Time course of the cell input resistance in control (n = 14 neurons), post-infusion of empty microcapsules (n = 15) or encapsulated QX-314 (n = 14), as indicated. (E) Traces, representative recordings of neuronal firing after whole-cell dialysis with different concentrations of QX-314, at two time points, as indicated. (F) Time course of the maximum cell firing rate for different concentrations of free QX-314, compared with encapsulated QX-314, added to the intracellular medium, as indicated. Data are mean ± SEM; *p < .05 (unpaired t-test).
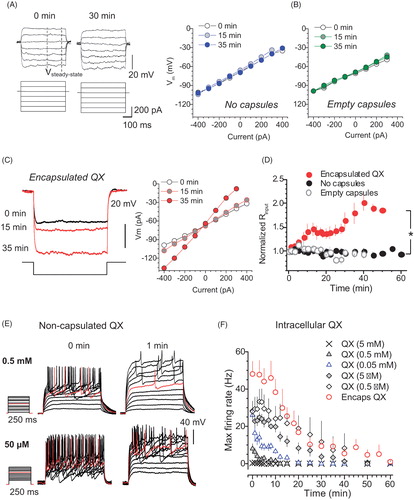
Figure 3. Long-lasting release of encapsulated cargo inside glabrous skin in situ. (A) Left image, acute skin tissue preparation from plantar surface of the rat hind paw (DIC image) depicting region of interest (ROI, dotted rectangle). Right images, ROI enlarged and shown in fluorescence channel (λx2P = 800 nm), depicting injected microcapsules (top, encapsulated Alexa Fluor 488), and the subsequently positioned micropipette tip filled with free Alexa Fluor 488 (bottom); dotted line: line-scan position. (B) Concentration kinetics of encapsulated Alexa Fluor 488 release from microcapsules in situ (mean ± SEM, n = 10); red line, best fit bi-exponential approximation (τ1, τ2: decay constants, 0.04 and 0.96 partial weights partial weights, respectively). (C) Image, example of line-scan (position in A, right bottom image; λx2P = 800 nm) depicting the escape of non-capsulated Alexa Fluor 488 injected from the micropipette. Graph, concentration kinetics of free Alexa Fluor 488 injected from the micropipette (0.75 s pressure pulse) in situ; red line, best fit bi-exponential approximation (τ1, τ2: decay constants, 0.08 and 0.92 partial weights, respectively). (D) Image, experimental arrangement for photon-counting of spatial Alexa Fluor 488 fluorescence escape: a single microcapsule shown in 99% glycerol (arrow, depiction of the radial profile calculation). Graph, radial profiles of Alexa Fluor 488 generated photon counts in two experimental conditions, as indicated (shaded area: capsule radius). (E) Image, example of a microcapsule in the epidermal–dermal area at different time-points (0–7 h, as indicated) following injection into acute skin tissue in situ (arrow, depiction of the radial profile calculation). Graph, radial profiles of Alexa Fluor 488 generated photon counts in the epidermal–dermal area, at different time points after injection, as indicated (shaded area: capsule radius).
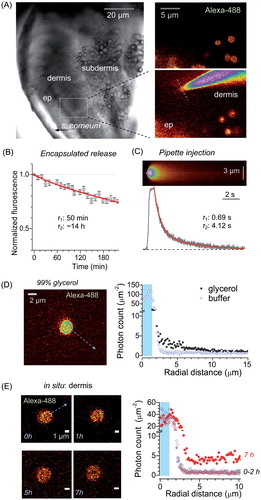
Figure 4. The anti-nociceptive effect of encapsulated QX-314 in a persistent pain model in rodents. (A) Image panels, examples of rat hind paw following injection of CFA with no treatment (top row) and with encapsulated QX-314 (∼3 mM; bottom row) at different time points, as indicated; ipsi, ipsilateral, inflammatory side; contra: contralateral, non-inflamed, side. Graph, time course of the thermal nociceptive threshold in control (contralateral, n = 5 rats) and CFA-inflamed animals injected with empty microcapsules (n = 5) or encapsulated QX-314 (∼3 mM, n = 6) or non-capsulated QX-314 (100 mM, n = 5), as indicated. (B) Time course of the thermal nociceptive threshold (normalized to that at the treatment onset, which is 24 h post-CFA), for different dosage of encapsulated QX-314, as indicated: 10 µM (n = 6 rats), 1 mM (n = 8), 3 mM (n = 6), and 7.5 mM (n = 7). (C) Fluorescent image (FITC fluorescence, transverse skin tissue section) displaying the epidermal–dermal area (the rat hind paw) with scattered microcapsules on Day 1 after microcapsule injection. (D) Time course of inflammatory hypersensitivity in rats with persistent peripheral inflammation following treatment with different amounts of QX-314 per capsule, as indicated (animals received the same overall dose of QX-314, 1 mM): 4.5 pg (n = 6 rats), 10 pg (n = 8) and 0 pg (empty, n = 5). (E) Time course of inflammatory hypersensitivity with QX-314 in microcapsules of different sizes (animals received the same overall dose of encapsulated QX-314, 3 mM): 2 µm diameter (n = 6 rats), 1 µm (n = 9) and empty (varied size, n = 5). Data are shown as mean ± SEM. **p < .01 (one-way ANOVA with Bonferroni post hoc test for encapsulated QX-314 compared with empty microcapsules).
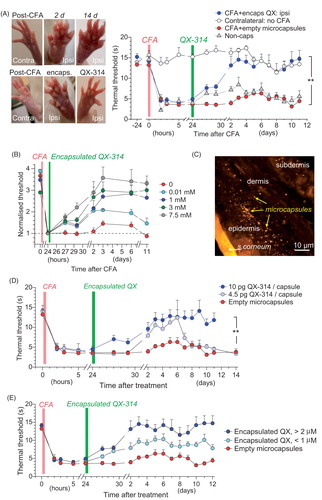
Figure 5. Encapsulated QX-314 abolishes locomotive deficit and anxiety in animals with persistent peripheral inflammation. (A) Examples of the open-field test trajectory records taken from one animal at different time-points following CFA injection and treatment with encapsulated QX-314 (1 mM, 1 day post-CFA), as indicated; D, overall distance (m) traveled over 10.0 min. (B) The effect of encapsulated QX-314 on animal locomotion: time course of the average exploration distance traveled by CFA-inflamed animals injected with encapsulated QX-314 (1 mM) or empty microcapsules, and by healthy animals (no CFA) injected with empty microcapsules. (C) The dose-effect of encapsulated QX-314 on exploratory activity in CFA-inflamed animals: time course of the average distance (normalized by that 1 day post-CFA) traveled by CFA-inflamed rats; treatment with empty capsules (n = 5 rats), 10 µM encapsulated QX-314 (n = 5), 1 mM encapsulated QX-314 (n = 5), 3 mM encapsulated QX-314 (n = 9), 10 mM encapsulated QX-314 (n = 6), as indicated. (D) The effect of encapsulated QX-314 on the average speed that animals could develop following treatment; notations as in (B). (E) The effect of encapsulated QX-314 on the animal’s anxiety, estimated as the average fraction (%) of time spent in the arena corners (correlative anxiety indicator; left) versus the arena center (anti-correlative anxiety indicator; right). Treatment with empty capsules (n = 5 rats), 10 µM encapsulated QX-314 (n = 5), 1 mM encapsulated QX-314 (n = 5). Data are shown as mean ± SEM. *p < .05, **p < .01 (one-way ANOVA with Bonferroni post hoc test).
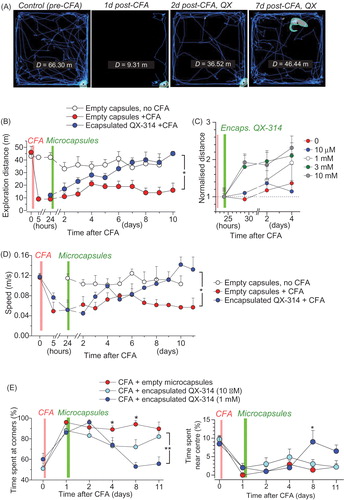
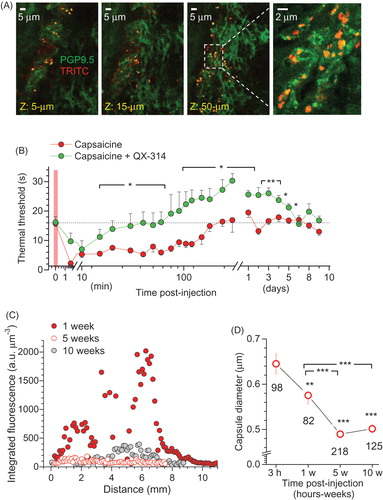
Figure 6. Microcapsules co-localize with peripheral nerve fibers, engage TRPV1-mediated analgesic effect of QX-314, and degrade with a time. (A) Examples of immunohistology of glabrous skin tissue (individual focal planes shown) for microcapsules carrying encapsulated QX-314 (3 mM; TRITC fluorescence, red) surrounding peripheral nerve fibers (neuron-specific PGP9.5 staining, green). Transverse skin sections (30 µm thick). (B) Time course of the thermal pain threshold in animals injected with capsaicin (1.5 µg µl−1, n = 6 rats) or with capsaicin together with 7.4 mM QX-314 (non-capsulated, n = 6). Data are mean ± SEM. *p < .05, **p < .01 (one-way ANOVA with Bonferroni post hoc test). (C) The z-axis profile of the microcapsule fluorescence (TRITC, λx2P = 820 nm; 3 mM encapsulated QX-314, integrated fluorescence) inside the skin tissue from the rat hind paw at different times post-injection in vivo, as indicated. Total scanned volume ∼370 µm3; 3 µm z-steps. (D) Averaged diameter of microcapsules inside the skin tissue from the rat hind paw at different time points post-injection in vivo, as indicated. The reduced diameter reflects progressive degradation of the outer capsule shell. Total number of analyzed capsules is indicated; **p < .01, ***p < .001 (one-way ANOVA with Fisher’s test).