Figures & data
Figure 1. Structure of MAHNP-DOX and its synthetic scheme.
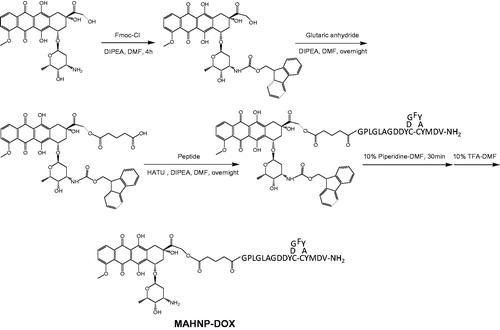
Figure 2. Comprehensive characterization of MAHNP-DOX. (A) The HPLC chromatograms of free DOX, N-Fmoc-DOX, N-Fmoc-DOX-14-O-hemiglutarate and MAHNP-DOX. The separation was performed on an XBridge®Prep OBDTM C18 column (5 μm, 19 × 150 mm; Waters, Milford, MA, USA) at room temperature. The flow rate was 0.3 mL/min with a mobile phase consisted of solvent A (water with 0.1% FA) and solvent B (ACN). The gradient was as follows: B 0 min (10%) → 15 min (90%) → 20 min (90%) → 25 min (10%). (B) The parent ion spectrum of MAHNP-DOX. The mass spectrometer was interfaced with an electrospray ion source and operated in the positive mode. Q1 and Q3 were both set at unit resolution. The flow of the drying gas was 10 L/min, while the drying gas temperature was held at 350 °C. The electrospray capillary voltage was optimized to 4000 V. The nebulizer pressure was set to 45 psi. The data were collected and processed using the Agilent MassHunter Workstation Software (version B.01.04). (C) The product ion spectrum of MAHNP-DOX. The collision energy was set at 30 eV. *=unique product ions of DOX. (D) HPLC profile of MAHNP-DOX cleavage after the treatment of conditioned medium from NIH-3T3 cells. The analysis was performed on XBridge™ C18 column (5 μm, 4.6 × 250 mm; Waters, Milford, MA, USA) at room temperature. The flow rate of HPLC was 0.3 mL/min with a mobile phase consisted of solvent A (water with 0.1% FA) and solvent B (ACN). The gradient was as follows: B 0 min (10%) →15 min (90%) →20 min (90%) →25 min (10%).
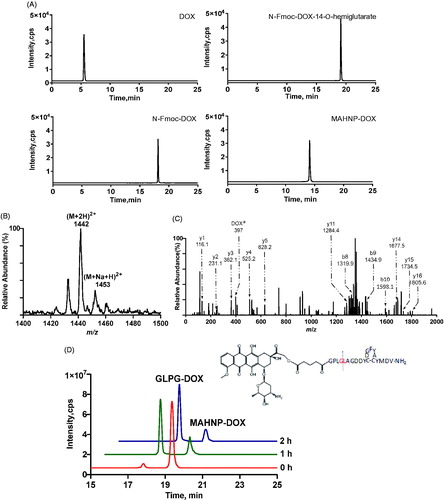
Figure 3. Cytotoxicity profiles of free DOX, MAHNP-DOX and MAHNP-DOX with MMP-2 inhibitor pretreatment of BT474 and SKBR3 cells (n = 3).
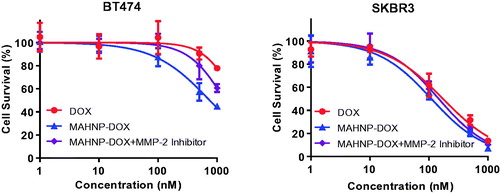
Figure 5. (A) Tumor volume change, (B) tumor weight and excised tumor on day 25 and (C) body weight change of mice with BT474 xenografts after the treatment with free DOX, MAHNP-DOX and saline. (D) In vivo images of mice and (E) drug concentration profiles in plasma (n = 3) are also shown. Two-tailed Student’s t-test was used. *p < .05, **p < .01.
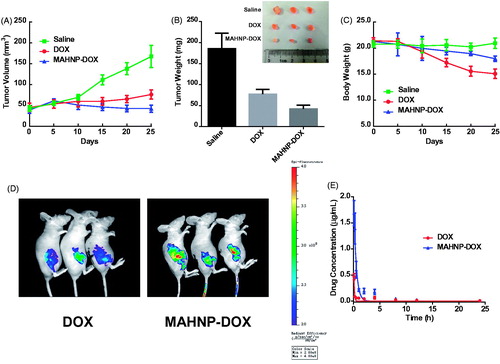
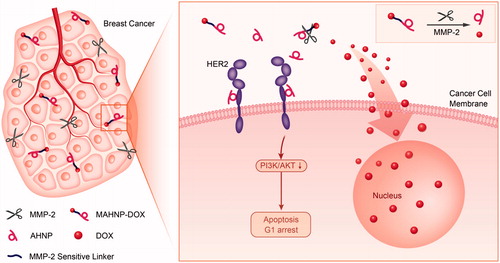
Figure 6. Molecular mechanism of MAHNP-DOX. MAHNP-DOX is cleaved extracellularly by MMP-2 and then DOX enters the cells, while the anti-HER2 peptide AHNP binds to HER2, inhibiting the HER2/PI3K/AKT signaling pathway and leading to cell arrest during G1 phase.