Figures & data
Table 1. Characterization of DOX-loaded modified and unmodified liposomes.
Figure 1. Transmission electron microscopy images of the modified and unmodified DOX-loaded liposomes. Represents 10,000× magnification, Scale bar, 500 nm.
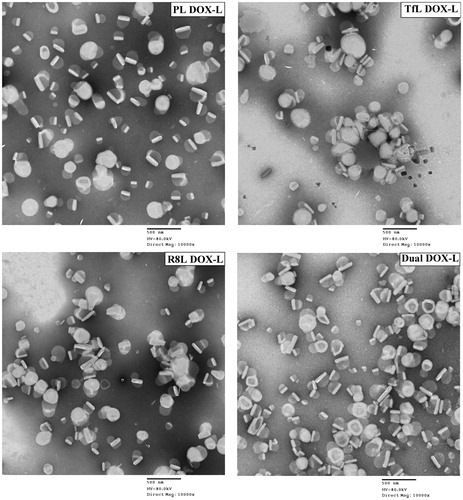
Figure 2. Interaction of rhodamine-labeled dual functional liposomes with A2780 cancer cells analyzed by flow cytometry. (a) Cell association of DualL with cancer cells for 1 h and 4 h treatment periods, followed by analysis by flow cytometry. (b) Effect of a macropinocytosis inhibitor, amiloride (5 mM, 30 min pre-incubation), on R8-mediated cell association for a 4 h liposome treatment period. (c) Evaluation of transferrin receptor-mediated endocytosis by competitive inhibition in presence of free excess Tf (2 mg/ml) in the treatment medium.(d) Comparison of cell association of DualL between NIH3T3, H9C2, CCD 27 SK non-cancer cells and A2780 cancer cells. Cells were incubated with liposomes at a total lipid concentration of 0.1 mg/ml. Results are plotted as fold increase in geometric mean fluorescence over plain liposomes and are mean ± SD, averaged from three separate experiments.*, **, ***, **** indicate p ≤ .05, .01, .001 and .0001, respectively analyzed by one-way ANOVA.
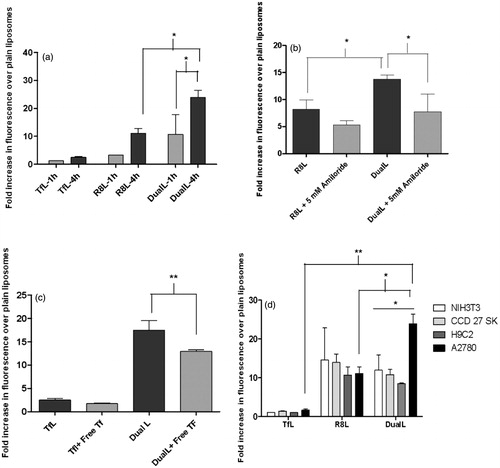
Figure 3. Receptor mediated endocytosis and macropinocytosis evaluation to confirm internalization of DualL. (a) A2780 cells were incubated with rhodamine-labeled PL, Tfl, R8L or DualL. Liposomes were added at a total lipid concentration of 0.1 mg/ml for a 4 h treatment period followed by analysis by confocal microscopy. (1) Nuclei stained by Hoechst 33342 at 5 µg/mL for 15 min; (2) Macropinosomes stained by FITC Dextran 70 KDa at 0.35 mg/mL for 30 min before formulation incubation; (3) Endosomes stained with Transferrin-Alexa fluor 680 at 22.5 µg/mL for 15 min; (4) Rhodamine-signal from liposomes; (5) Merged composite picture of all the fluorescence; (6) Co-localization of rhodamine with FITC Dextran (7) Co-localization of rhodamine with Alexa Fluor. Yellow signals in the merged images indicate the co-localization of the red and green, red and pinkish fluorescence represents co-localization of red and gray, respectively. Analysis of fluorescence intensity-colocalization Pearson's coefficient (b) and Mander’s coefficients (c), obtained from the merged pictures (n = 3) from TfL, R8L and DualL-treated cells, by Image J software. The results are mean ± SD averaged from three images of the same treatment. *, **, ***, **** indicate p ≤ .05, .01, .001 and .0001, respectively. Analyzed by Student’s t-test. Scale bar, 25 µm.
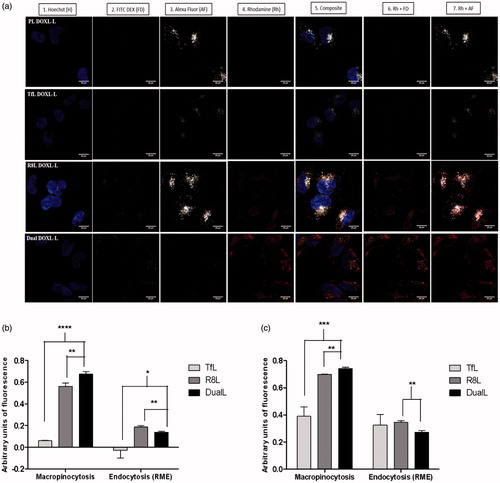
Figure 4. Intracellular DOX release. A2780 cells were incubated with Dio-labeled PL DOX-L, Tf DOX-L, R8 DOX-L or Dual DOX-L. Liposomes were added at a total lipid concentration of 0.1 mg/ml for 4 h treatment period followed by analysis by confocal microscopy. (a) (1) Nuclei stained by Hoechst 33342 at 5 µg/mL for 15 mins; (2) Dio stain from liposome bilayer; (3) DOX stain; (4) Merged composite picture of all fluorescence; (5) Co-localization of DOX with Hoechst; (6) Co-localization of Dio with DOX; (7) Merged image of Hoechst and Dio. Yellow signals in the merged images indicate the co-localization of the red and green indicating cytoplasmic delivery, and purple fluorescence represents co-localization of red and blue indicating nuclear delivery, respectively. Analysis of fluorescence intensity co-localization (b). Pearson's coefficient and (c). Mander’s coefficient, obtained from the merged pictures (n = 3) from Tf DOX-L, R8 DOX-L and Dual DOX-L-treated cells, by Image J software. The results are mean ± SD averaged from three images of the same treatment. *, **, ***, indicate p ≤ .05, .01 and .001 respectively. Analyzed by Student’s t-test. Scale bar, 10 µm.
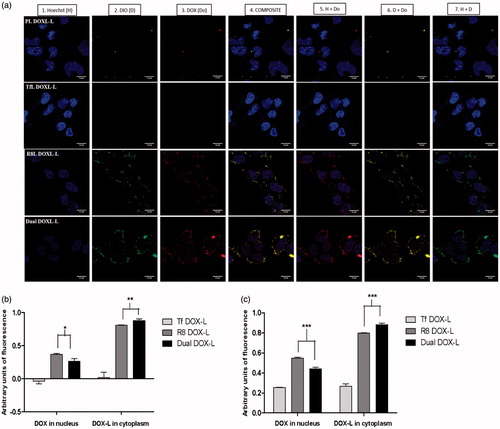
Figure 5. Effect of dual functional DOX-loaded liposomes on cell death in cancer and non-cancer cells. Assessment of cell viability of A2780 cells treated with DOX-loaded PL DOX-L, Tf DOX-L, R8 DOX-L and Dual DOX-L, at DOX concentration of 0.2—75 µM for 15 min followed by 24 (a) or 48 h (b) incubations. Comparison of cell death in A2780 cancer and NIH3T3, H9C2, CCD27Sk non-cancer cells at 75 µM. Cells treated with DOX-loaded PL DOX-L, Tf DOX-L, R8 DOX-L and Dual DOX-L for 15 min followed by 24 (c) or 48 h (d) incubations. Results obtained as mean ± S.D. from three separate experiments. * indicates p < .05, ** indicates p < .01, *** indicates p < .001analyzed by one-way ANOVA.
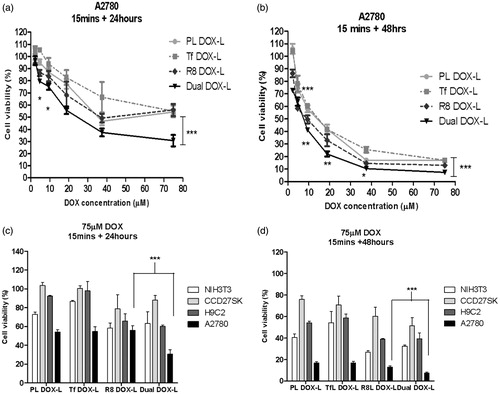
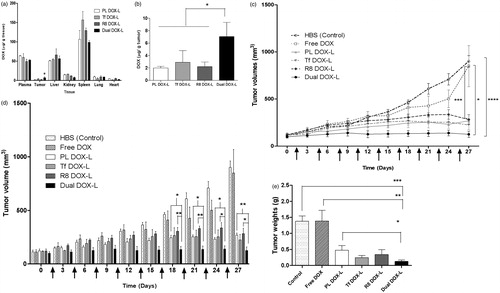
Figure 6. Evaluation of in vivo therapeutic efficacy of Dual DOX-L. Biodistribution of Dox in mice bearing A2780 tumors. (a) Represents distribution of DOX in major organs. (b) Represents distribution of DOX in tumors across 4 tested groups. A single 10 mg/kg i.v. tail injection of PL DOX-L, Tf DOX-L, R8 DOX-L and Dual DOX-L was administered. After 10 h the mice were sacrificed and major organs and tumors were collected. N = 2 animals per group ± SD. Analyzed by one-way ANOVA where *p < 0.05. Effect of i.v. administration of liposomes on tumor growth in nude mice bearing A2780 tumors. Treatment groups were HBS (control), Free DOX, PL DOX-L, Tf DOX-L, R8 DOX-L, and Dual DOX-L. Arrows indicate day of treatment with the formulations given after tumors reached 50–150 mm3. (n = 4, mean ± SEM). Calculated from day 0 to day 27 of treatment. (c) Represents a line graph showing the trend of tumor growth. (d) Represents a column graph of tumor volumes for all groups. (e) A2780 tumor weights at the end of the study. Treatment was stopped and tumors were excised when the average tumor volume in the control group reached 1000 mm3. Represented as mean ± SEM. *, **, ***, **** indicate p ≤ .05, .01, .001 and .0001, respectively analyzed by Student’s t-test.