
Figures & data
Figure 1. (A) Chemical structure of zidovudine (AZT). (B) Fourier transform infrared spectroscopy (FTIR)-spectra of BHT (butylated hydroxytoluene), CHO (cholesterol), ML (lipid), SL (soya lecithin), AZT (zidovudine), PM (physical mixture of BHT, CHO, ML), PMD (physical mixture of BHT, CHO, ML, and drug), PM-1 (physical mixture of BHT, CHO, SL), PMD-1 (physical mixture of BHT, CHO, SL, and drug), MGB (ML-based lyophilized formulation without drug), MGF (ML-based lyophilized formulation with drug), SYB (SL-based lyophilized formulation without drug), and SYF (SL-based lyophilized formulation with drug).
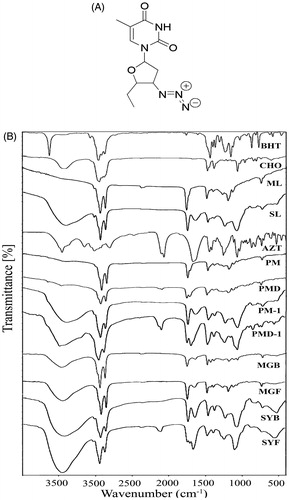
Figure 2. Particle size distribution of (A) MGF and (B) SYF. Zeta potential of (C) MGF and (D) SYF. Field emission scanning electron microscopy (FESEM) images of (E) MGF at magnification of 60,000×, (F) MGF at magnification of 120,000×, (G) MGF at magnification of 300,000×, (H) SYF at magnification of 100,000×. Cryo-transmission electron microscopy (Cryo-TEM) images of (I) MGF and (J) SYF. Scale bar for Cryo-TEM image: 100 nm. (K) In vitro drug release profiles of MGF and SYF in phosphate buffer (pH 7.4). (L) In vitro drug release profiles of MGF and SYF in 50% serum. Data show mean ± SD (n = 3). SD: standard deviation.
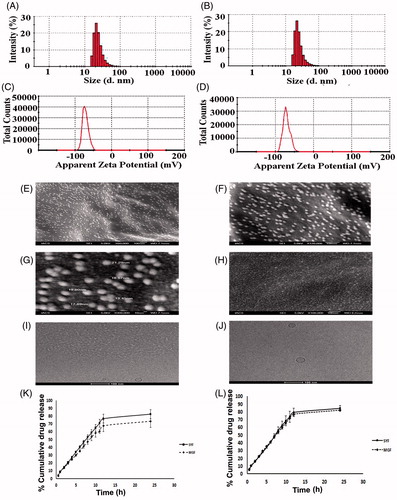
Figure 3. Investigation of in vitro cellular uptake of MGF and SYF by confocal microscopy. (A) In vitro cellular uptake study of fluorescein isothiocyanate labeled MGF (FITC-MGF) in U-87 MG human glioblastoma cells at various time points (0.25 h, 1 h, 3 h). (B) In vitro cellular uptake study of fluorescein isothiocyanate labeled SYF (FITC-SYF) in U-87 MG human glioblastoma cells at various time points (0.25 h, 1 h, 3 h). DIC: differential interference contrast images of U-87 MG human glioblastoma cells.
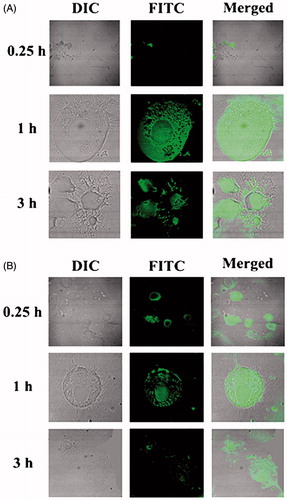
Figure 4. Gamma scintigraphy images of rats after receiving radiolabeled MGF/radiolabeled SYF/radiolabeled AZT. (I) rats received 99mTc labeled MGF at 1 h (A, B) and at 5 h (C, D) post i.v. injection; (II) rats received 99mTc labeled SYF at 1 h (E, F) and at 5 h (G, H) post i.v. injection; (III) rats received 99mTc labeled free drug at 1 h (I, J) and at 5 h (K, L) post i.v. injection. A, C, E, G, I, and K are whole animal image; B, D, F, H, J, and L are magnified brain part.
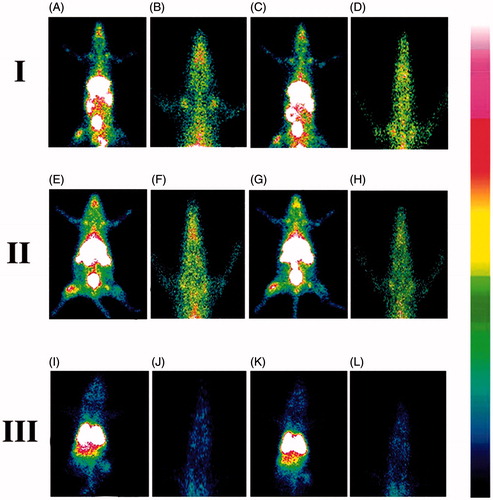
Figure 5. In vivo pharmacokinetic parameters in plasma and brain. (A) Plasma concentration of AZT–time profiles after i.v. administration of MGF/SYF/free drug (AZT) suspension in rats. (B) Concentration of AZT in brain after i.v. administration of MGF/SYF/AZT suspension in rats represented by bar diagram. Data showed mean ± SD (n = 3). SD of each point was represented by error bar. SD: standard deviation represented by deviation bar.
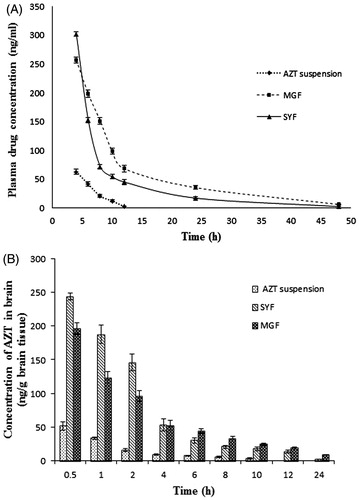
Table 1. Plasma and brain pharmacokinetic parameters of AZT after i.v. administration of MGF/SYF/free drug (AZT) suspension in rats.