Figures & data
Figure 1. Characterization and ROS generation of LIH. (A) Schematic illustration of alleviation of tumor hypoxia and enhanced PDT based on photosensitizer and hemoglobin co-loaded liposomes (LIH). (B) The pO2 of oxygen saturated Hb and LIH at 24 h determined by oximeter. (C) The photos for the LIH solution (before lyophilization), the powder of LIH (after lyophilization), and the LIH solution (the re-suspended). (D) The diameter of LIH in eight weeks after preparation and the concentration of Hb was found to be 2 mg/ml. (E) TEM images of LI and LIH. Scale bar, 100 nm. (F) ROS generation of LI or LIH exposure to NIR laser in normaxia conditions. (G) ROS generation of LI or LIH exposure to NIR laser in hypoxia conditions.
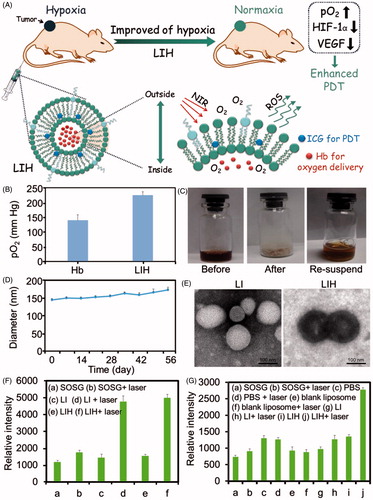
Figure 2. Cellular uptake and hypoxia alleviation of LIH in CT-26 cells. (A) Confocal microscopy images of cellular uptake of LIH liposomes in normaxia condition. Scale bar, 50 μm. (B) The semi-quantitative analysis of fluorescence intensity in (A) determined by ‘Image J’ software. (C) Cellular uptake of LIH liposomes at 24 h in CT-26 cells determined by a flow-cytometer under normaxia and hypoxia conditions. (D) Immunostaining analysis of HIF-1α expression in CT-26 cells under different incubation environment. Scale bar, 50 μm. (E) The quantitative analysis based on the images in (D) by ‘Image J’ software. (F) Western blot analysis of HIF-1α expression in CT-26 cell lines. (G) Semi-quantitative analysis of percentage in (F). All the data were analyzed by one-way ANOVA (*p ≤ .05; **p ≤ .01).
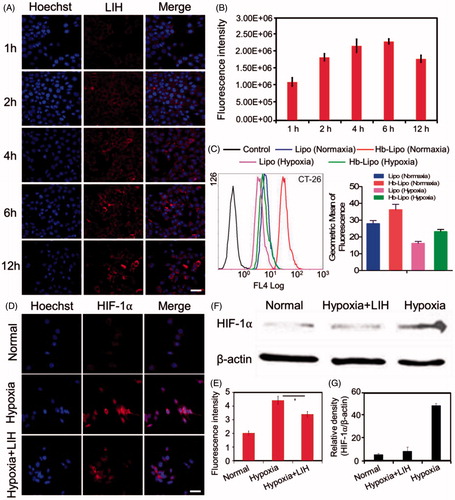
Figure 3. PDT efficiency of LIH. Intracellular ROS detection of PBS, LI, and LIH under (A) normaxia and (B) hypoxia condition with or without laser irradiation (808 nm, 1 W/cm2, and 1 min). Cytotoxicity of LI and LIH against CT-26 cells in (C) normaxia and (D) hypoxia environment without or with laser irradiation (808 nm, 1 W/cm2, and 1 min).
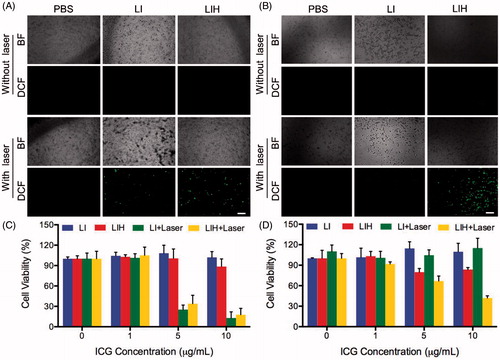
Figure 4. Biodistribution of LIH in xenograft S180 , CT-26 tumor, and orthotopic CT-26 tumor model mice. (A) In vivo fluorescence imaging of LI and LIH in S180 tumor bearing ICR mice post intravenously injection. (B) The fluorescent images of various tissues at 24 h after injection of LI and LIH. (C) The LI and LIH in various tissues were calculated as the average fluorescent intensity, representing the amount of the liposomes. (D) In vivo fluorescence imaging of LIH in CT-26 tumor bearing ICR mice post intravenously injection. (E) The fluorescent images of various tissues at 48 h after injection of LIH. (F) The LIH in various tissues was calculated as the average fluorescent intensity, representing the amount of the liposomes. (G) In vivo bio-luciferase imaging of orthotopic CT-26-Luc tumor after injection of D-luciferin. (H) In vivo fluorescence imaging of LIH at 24 h post injection. (I) The fluorescence imaging of organs and tumor of orthotopic CT-26-Luc tumor bearing mice at 24 h after intravenously injection of LIH. (J) The LIH in various tissues was calculated as the average fluorescent intensity.
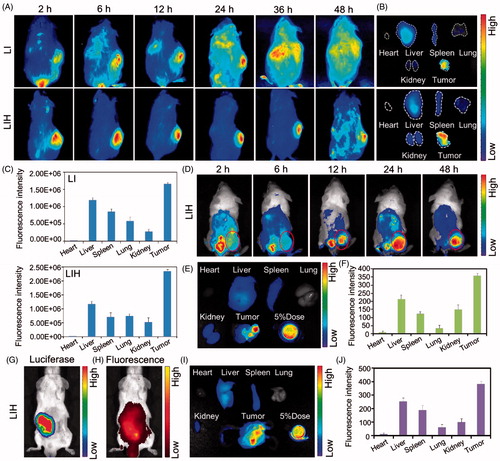
Figure 5. Effects of LIH on tumor hypoxia alleviation. (A) The expression of HIF-1α and VEGF in CT-26 subcutaneous tumor model mice treated with saline, LI, or LIH. Scale bar, 100 μm. (B) Representative immunofluorescence images of tumor slices after hypoxia staining. Scale bar, 50 μm. (C) The relative hypoxia positive area, HIF-1α ,and VEGF receptor were recorded from more than ten micrographs for each group by ‘Image J’ software. (D) The expression of HIF-1α and VEGF in CT-26 orthotopic tumor of mice treated with LI or LIH. Scale bar, 100 μm. (E) Representative immunofluorescence images of tumor slices after hypoxia staining. Scale bar, 100 μm. (F) The relative hypoxia positive area, HIF-1α,and VEGF receptor were recorded from more than 10 micrographs for each group by ‘Image J’ software. (G) Representative immunofluorescence images and semi-quantitative analysis of tumor slices after hypoxia staining by antipimonidazole antibody (green). Scale bar, 100 μm. (H) Representative immunofluorescence images and semi-quantitative analysis of tumor slices after HIF-1α staining by anti-HIF-1α antibody (green). Scale bar, 100 μm. (I) Representative immunofluorescence images and semi-quantitative analysis of tumor slices after VEGF staining. Scale bar, 100 μm. (J) Effect of liposomes on tumor oxygen on day 2 after intravenously injection of LI or LIH. A significant increase in T2* values of tumors treated with LIH at day 2 after injection. (K) T2-weighted MR image intensity in (J). (L) Representative intratumoral DCFH-DA fluorescence images as an indicator of ROS generation level. Scale bars, 50 μm. (M) Mean fluorescence intensity of DCFH-DA (ROS) inside the tumors.
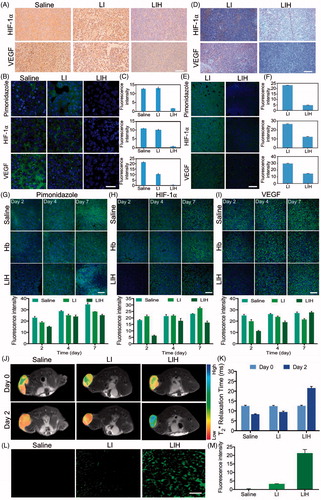
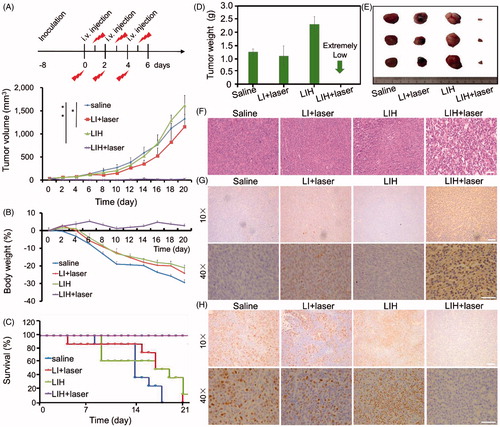
Figure 6. In vivo enhanced PDT with LIH. (A) Schematic of the time course of the efficacy study. Tumors growth curves for the mice bearing CT-26 tumors after being treated with saline, LI plus laser, LIH, and LIH plus laser. The tumors were irradiated by NIR laser at 24 h after intravenous injection (808 nm, 1.5 W/cm2, and 3 min). (B) Change of mice body weight noted within 19 days . (C) Survival rates of mice within 21 days. (D) Average tumor weight after treatment. (E) Representative tumor image of various groups. (F) Histological observation of tumor tissues via H&E staining. Scale bars, 50 μm. (G) Detection of PDT-induced apoptosis in tumor tissues with TUNEL staining assay. Blue signal: cell nucleus; green signal: apoptotic cells. Scale bars, 50 (10×) and 100 μm (40×). (H) Detection of proliferation in tumor tissues with Ki67 staining assay. Blue signal: cell nucleus; green signal: proliferative cells. Scale bars, 50 (10×) and 100 μm (40×).