Figures & data
Table 1. Experimental runs, independent variables, and measured responses of the 23 full factorial experimental design of PMMs.
Figure 1. 3-D plot model graphs demonstrating the effect of factors; X1: weight ratio of total Pluronics to drug, X2: weight ratio of Pluronic P123 to Pluronic F127, and X3: percent of Cremophor EL in aqueous medium on micellar incorporation efficiency percent (MIE%) (a and b) and mean micellar size (c and d).
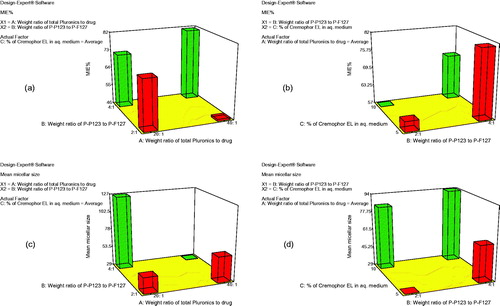
Figure 2. Transmission electron micrograph of the optimal PMMs formulation (F7).
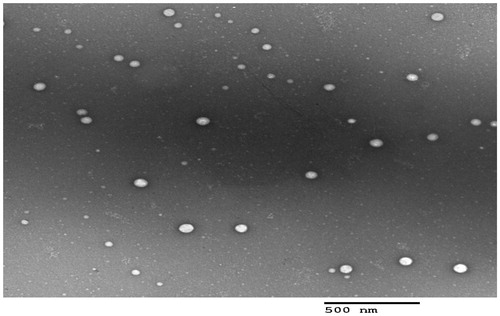
Figure 3. (a) Cumulative amount of TCZ permeated per unit area across skin via optimal PMMs formulation (F7) compared to PMMs lacking Cremophor EL and TCZ suspension. (b) Cumulative amount of TCZ deposited per unit area in the skin via optimal PMMs formulation (F7) compared to TCZ suspension.
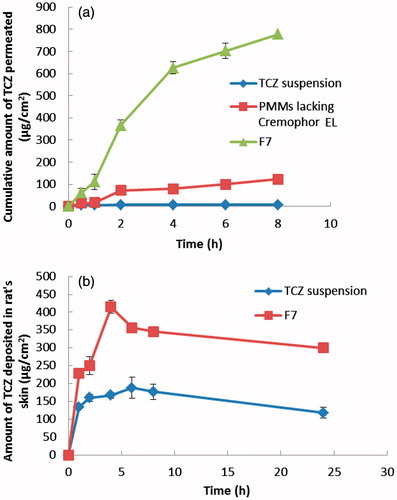
Table 2. Parameters obtained from ex vivo studies for the optimal PMMs (F7), PMMs lacking Cremophor EL, and TCZ suspension.
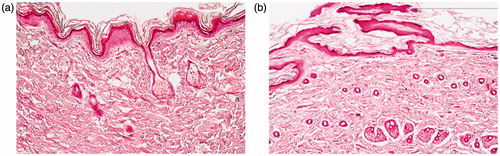
Figure 4. Photomicrographs showing histopathological sections (hematoxylin and eosin stained) of (a) normal untreated rat skin and (b) rat skin treated with optimal PMMs formulation (F7).