Figures & data
Figure 1. In vivo tumor growth inhibition (A) and body weight changes (B) of mice bearing SKOV-3 ovarian cancer xenografts after IT treatment with PBS(![]()
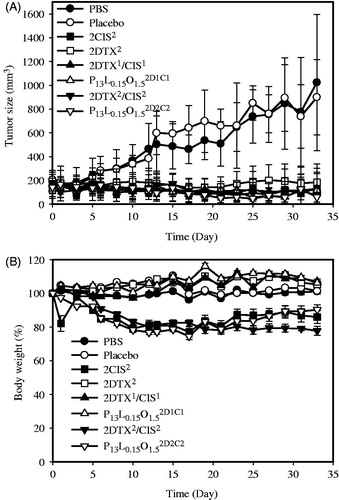
Figure 2. In vivo tumor growth inhibition (A) and body weight changes (B) of mice bearing SKOV-3 ovarian cancer xenografts after PT treatment with PBS (![]()
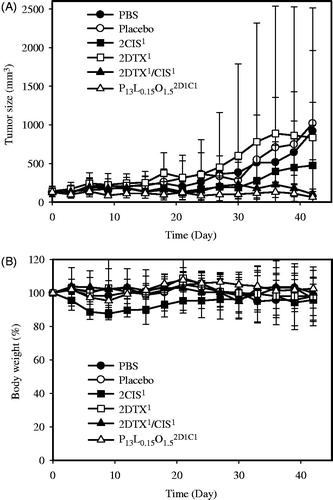
Figure 3. In vivo pharmacokinetic profiles of DTX (A) and CIS (B) after being treated with 2DTX2 (IV, ![]()
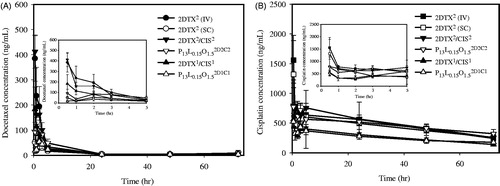
Table 1. Pharmacokinetic parameter estimations of DTX in plasma of normal balb/c mice after being treated with 2DTX2 (4 mg/kg, IV) through a tail vein and 2DTX2 (4 mg/kg, SC), 2DTX2/CIS2 (4 mg/kg each, SC), P13L0.15O1.52D2C2 (4 mg/kg each, SC), 2DTX1/CIS1 (2 mg/kg each, SC), and P13L0.15O1.52D1C1 (2 mg/kg each, SC).
Table 2. Pharmacokinetic parameter estimations of CIS in plasma of normal balb/c mice after being treated with 2CIS2 (4 mg/kg, IV) through a tail vein and 2CIS2 (4 mg/kg, SC), 2DTX2/CIS2 (4 mg/kg each, SC), P13L0.15O1.52D2C2 (4 mg/kg each, SC), 2DTX1/CIS1 (2 mg/kg each, SC), and P13L0.15O1.52D1C1 (2 mg/kg each, SC).
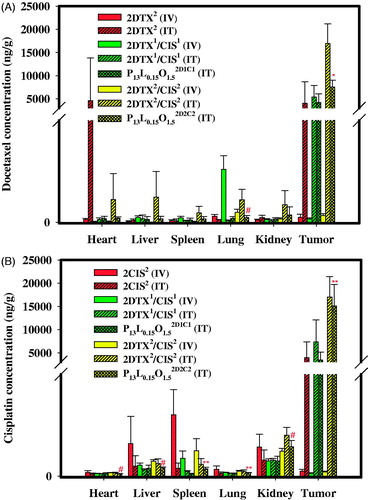
Figure 4. Tissue distributions of DTX (A) and CIS (B) 72 h after IV and IT administration of 2DTX2 (4 mg/kg, IV), 2CIS2 (4 mg/kg, IV), 2DTX2 (4 mg/kg, IT), 2CIS2 (4 mg/kg, IT), 2DTX1/CIS1 (2 mg/kg each, IV), 2DTX1/CIS1 (2 mg/kg each, IT), P13L0.15O1.52D1C1 (2 mg/kg each, IT), 2DTX2/CIS2 (4 mg/kg each, IV), 2DTX2/CIS2 (4 mg/kg each, IT), and P13L0.15O1.52D2C2 (4 mg/kg each, IT) into SKOV-3 tumor-bearing Balb/c nude mice. Data are expressed as the mean ± SD (n = 4).