Figures & data
Figure 1. Design and characterization of cationic KLDD peptide. (A) Fabrication of MT-loaded SAP hydrogel for AKI therapy. (B) Representative TEM images of KLDD nanofibers (1 mg/ml, scale bar =100 nm). (C) Determination of the diameter of KLDD nanofibers by DLS. (D) Evaluation of injectable KLDD hydrogel formation in DMEM solution. (E) In vitro release of free MT, MT-loaded KLD, and MT-loaded KLDD in PBS (KLDD vs. control, *p < .05; **p < .01; KLDD vs. KLD, #p < .05).
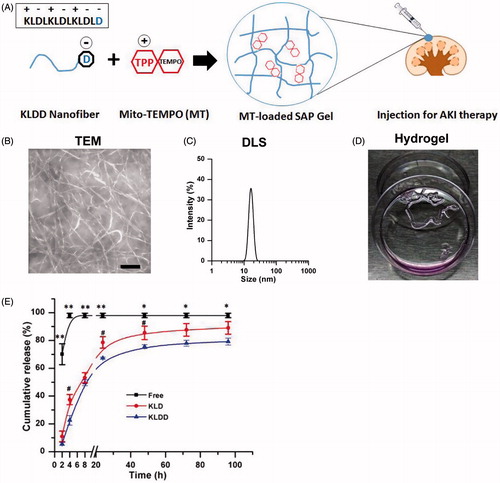
Figure 2. Slow release of MT rescued persistent mitochondria dysfunction after AKI. (A) Real-time PCR analysis for renal mitochondrial function-related genes including TFAM, ATP5α-1, PGC-1α, and NDUFS8 at day 5 after IRI. (B) Detection of kidney mtROS production by frozen section and MitoSOX staining (Scale bar =25 μm). (C) Quantification of mtROS level in kidney measured by MitoSOX staining. (D) Representative TEM micrographs of mitochondria in TECs at day 5 after IRI (Scale bar =1 μm). (E) Quantification of mitochondrial length/width ratio detected by TEM (*p < 005; **p < .01; and ***p < .001).
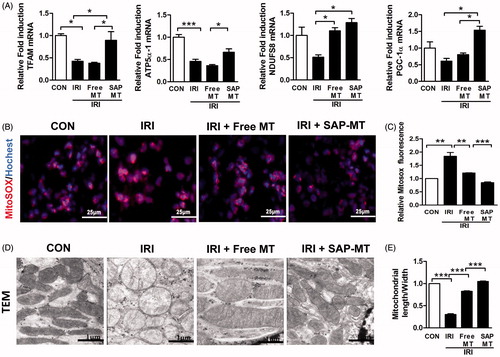
Figure 3. Slow release of MT sustainably restored mitochondria biogenesis after AKI. (A) Representative IF staining for mitochondrial TFAM at day 5 after IRI (Scale bar =50 μm). (B) Representative IHC staining for mitochondria protein COX IV and TFAM at day 5 after IRI (Scale bar =50 μm). (C) Quantification of renal COXIV and TFAM expression detected by IHC using image pro-plus analysis (*p < .05 and **p < .01; ***p < .001).
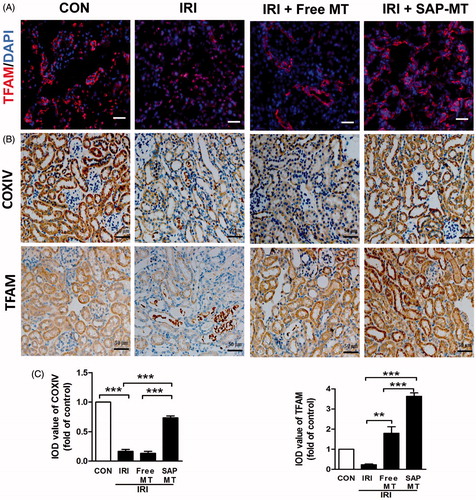
Figure 4. Slow release of MT alleviated prolonged kidney injury after AKI. (A) Representative micrographs of renal HE, TUNEL (Scale bar =50 μm), and Kim-1 IF staining at day 5 after IRI (Scale bar =100 μm). (B) Quantification of tubular necrosis areas detected by HE staining. (C) Quantification of Kim-1 expression in kidney. (D) Quantification of TUNEL-positive cells in kidney (*p < .05; **p < .01 and ***p < .001).
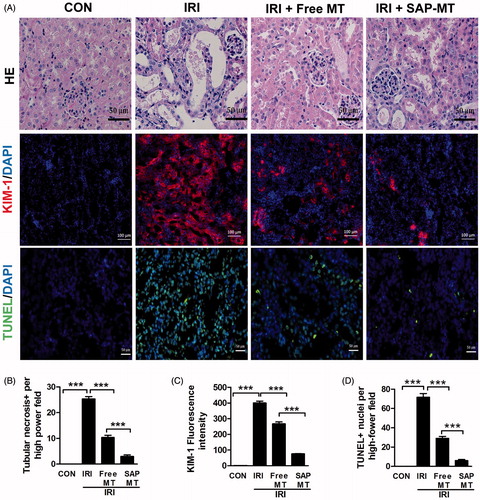
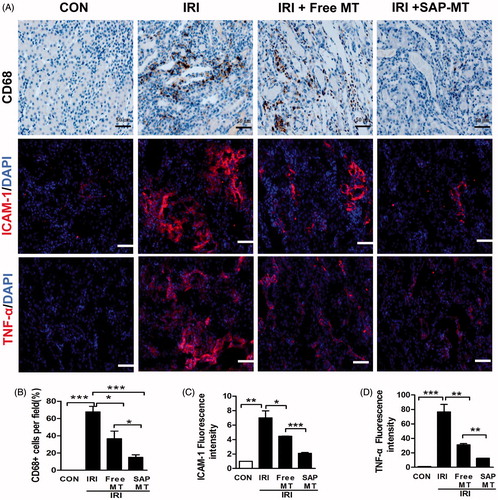
Figure 5. Slow release of MT reduced chronic renal inflammatory response after AKI. (A) Representative micrographs of IHC staining for CD68, ICAM-1, and TNF-α at day 5 after IRI (Scale bar =50 μm). Quantification of (B) CD68-positive macrophages, (C) ICAM-1, and (D) TNF-α protein levels detected by IHC using image pro-plus analysis (*p < .05; **p < .01 and ***p < 0.001).