Figures & data
Figure 1. (A) Schematic description of the synthesis of Tween 60@2β-CD self-assembly vesicles loaded with DOX and their accumulation in tumor.
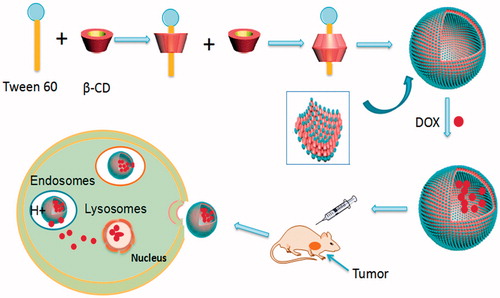
Figure 2. A, B, C, D was DLS, TEM, FF-TEM, AFM image of Tween 60@2β-CD self-assembly vesicles, respectively. E was sectional height profile of a collapsed vesicle chosen in D.
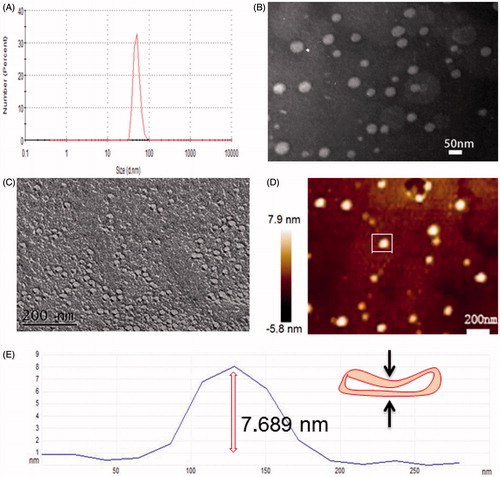
Figure 3. Micro-IR image of Tween 60/β-CD vesicles, Tween 60, and β-CD.
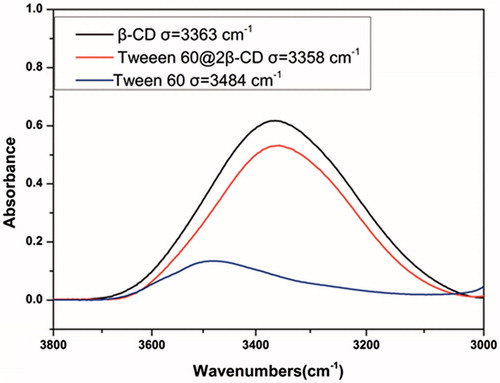
Figure 4. (A) TEM image of DOX-loaded vesicles. (B) DLS image of DOX loaded vesicles. (C) Zeta Potential image of DOX loaded vesicles. (D) In vitro, DOX release from vesicles in pH 7.4 and pH 5.8.
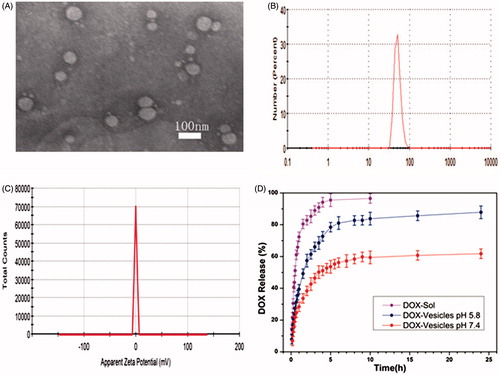
Figure 5. Internalization and accumulation of DOX in Hela cells were conducted with DOX-Sol or DOX-vesicles for 4 h, measured by confocal microscopy. Scale bar is 50 µm.
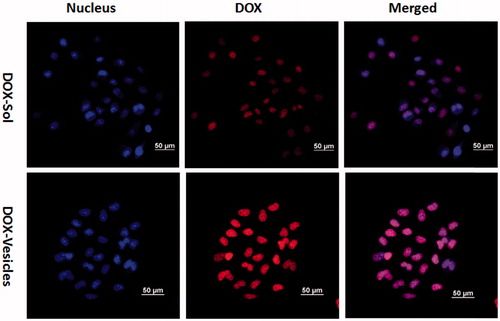
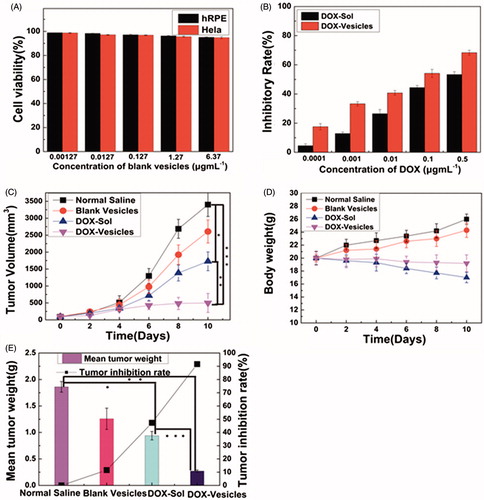
Figure 6. (A) The cell viability of blank vesicles against hRPE cells and Hela cells at different concentrations of Tween 60@2β-CD. (B) Inhibitory rate of DOX-Sol and DOX-Vesicles against Hela cells at different concentrations of DOX. (C) Changes in tumor volume after intravenous injection of normal saline, blank vesicles, DOX-Sol, and DOX-Vesicles. (D) The body weight variations of every group. (E) The tumor inhibition rate and mean tumor weight between groups after 10 days treatment with normal saline, blank vesicles, DOX-Sol, and DOX-Vesicles. (The tumor volume and mean tumor weight between groups was compared by Student’s t-test ★p < .05, ★★p < .01, ★★★p < .001).