Figures & data
Figure 1. TGA analysis. Evolution of mass of the samples over time (19.8 mg of dry particles). pSiO2: bare oxidized particles; pSiO2-COOH: particles grafted with linker (free COOH function); pSiO2-COO-Dex: particles loaded with dexamethasone.
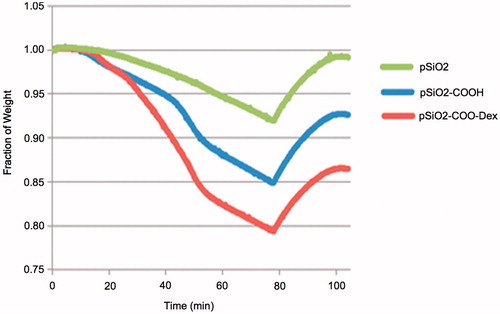
Figure 2. OCT of subretinally injected Matrigel at the medullary ray. These simultaneous FA and OCT images at different time points were acquired 15–20 minutes after intravenous injection of sodium fluorescein. OCT demonstrated that the retinal detachments and subretinal fluid diminished over time. The sodium fluorescein pooling into the subretinal fluid was recognizable (arrow) and decreased in area and intensity over time. It did not completely disappear by week 8. The vitreous opacity or granules (arrowhead) immediately above the detached retina were recognizable in OCT frames, indicating inflammation.
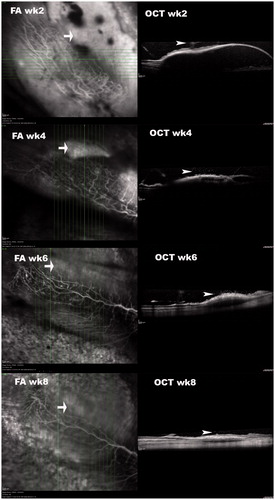
Figure 3. pSiO2-COO-DEX treatment vs. controls. The images of the left column are from a control eye (BSS injection); the images in the middle column are from one of the free Dex injected eyes; and the images of the right column are from an eye treated by intravitreal pSiO2-COO-DEX (pSi-Dex). All eyes were relatively quiet during the first week after subretinal VEGF/Matrigel injection and the clear vitreous allows identification of the two subretinal blebs (arrows) on the color fundus images. After pharmacological intervention, severe vitritis emerged in the eyes injected with BSS or free Dex. Retinal neovascularization on the medullary ray (arrowheads) was spotted during week 4 and persisted until the end of the study. In contrast, vitritis was mild and no neovascularization was noted on the medullary ray in the eyes injected with pSiO2-COO-DEX (far right column).
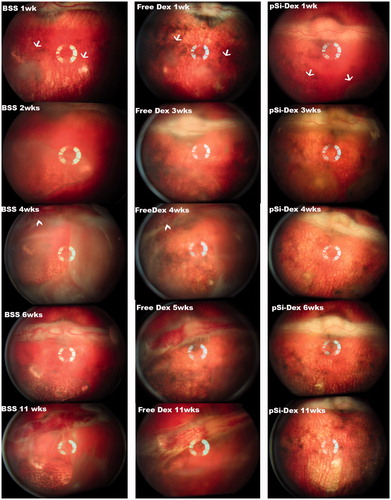
Figure 4. pSiO2-COO-DEX treated eye FA and OCT. FA image in the upper left column, two weeks after the subretinal VEGF/Matrigel injection, shows two round areas of hypofluorescence corresponding to the subretinal injections (arrows). Subretinal Matrigel blocked the fluorescence from the underlying choroid. Vitritis is seen here as black strands in the vitreous, blocking the fluorescence from the choroid underneath. The OCT image in the upper right column demonstrates a dome-shaped retinal bleb with trapped Matrigel within. The lower panel is from the same eye 11 weeks after Matrigel injection or 8 weeks after pSiO2-COO-DEX (pSi-Dex) intravitreal injection. The FA image shows clear vitreous and two round areas of uneven fluorescence corresponding to the atrophic retinal blebs (arrow). The OCT image on the right shows retinal thinning at the bleb area. The arrow points the edge of the atrophic area.
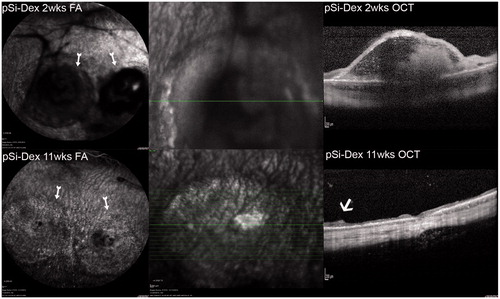
Figure 5. Inflammation and PVR scores. The left panel bar graph demonstrates total inflammation in aqueous and vitreous for eyes injected at the medullary ray (MR) or visual streak (VS) with different formulations of intervention. In general, the inflammation scores descended over time. The eyes with Matrigel + VEGF injection at the visual streak (VS) had a stronger inflammatory reaction compared to the eyes injected with Matrigel only under the medullary ray. The right panel bar graph demonstrates significantly more PVR in the eyes injected with Matrigel + VEGF and intervened with intravitreal BSS or free Dex as compared with the eyes treated with intravitreal pSiO2-COO-DEX (VS_pSiDex).
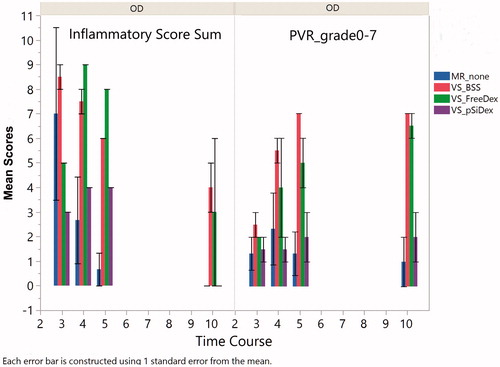
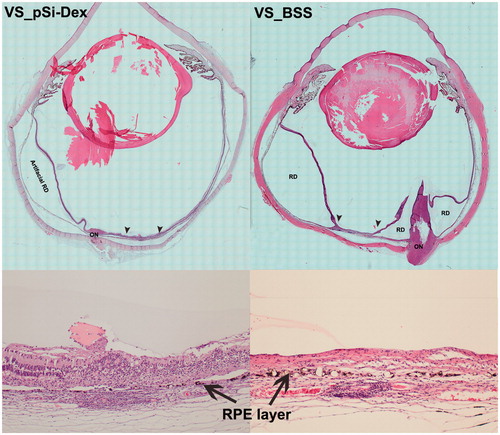
Figure 6. Histological analysis. The two images in the left column are from an eye treated with intravitreal pSiO2-COO-DEX (pSi-Dex) while the two images on the right column are from an eye treated by intravitreal BSS as control. In both eyes, the subretinal Matrigel + VEGF was injected in the visual streak (VS). The two images at the bottom are 10× light microscopy images corresponding to the area between the two arrowheads in the montages above. The montage VS_pSiO2-COO-DEX (VS_pSi-Dex) displays the injection site (between two arrowheads) next to the optic nerve (ON) and artificial retinal detachment (RD) from histological processing, evidenced by detachment between the RPE and choroid instead of neuroretinal detachment. In contrast, the montage VS_BSS demonstrates prominent proliferation of the optic nerve (ON) protruding into the vitreous, causing multiple pathological retinal detachments (RD). The RD inferior to the injection site is pathological RD with stiff retina and retinal gliosis. The magnified injection area shows RPE (arrows) damage and irregular proliferation with overlying retina atrophy and disorganization (Bottom images).