Figures & data
Figure 1. Development and characterization of nanoemulsions. Schematic representation of the loaded nanoemulsion (A), size (B) and zeta potential (C) of formulations obtained without chitosan, size (D) and zeta potential (E) of nanoemulsions obtained with chitosan according to the first protocol (in which chitosan was mixed in the aqueous phase), size (F) and zeta potential (G) of pre-formed nanoemulsions after incubation with chitosan solution (second protocol); all formulations contain tributyrin, and representative graphs resulting from analysis of three formulations from different batches are depicted in these panels. (H) Rheological behavior and viscosity of nanoemulsions with and without chitosan; data shown as average of two samples from different batches. (I) Influence of tributyrin concentration when added into the oil phase on the nanocarrier cytotoxicity against MCF-7 and RPE-cells cells; data shown as average ± standard error, n = 9–12.
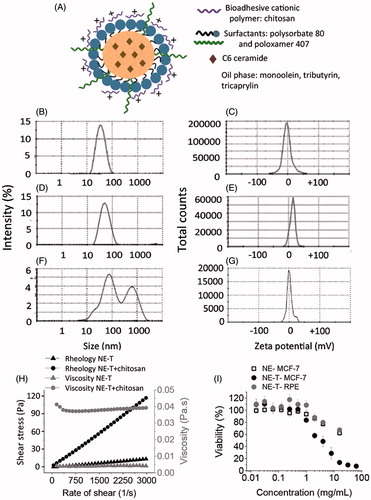
Figure 2. Bioadhesive properties of the optimized nanoemulsion as demonstrated by changes on size and zeta potential. (A, C, E) Size of aggregates resulting from the incubation of the nanoemulsion with PBS (A), mucin dispersion with PBS (C) or nanoemulsion with the mucin dispersion (E). (B, D, F) Zeta potential of aggregates resulting from the incubation of the nanoemulsion with PBS (B), mucin dispersion with PBS (D) or nanoemulsion with the mucin dispersion (F). The figure shows representative graphs, n = 3.
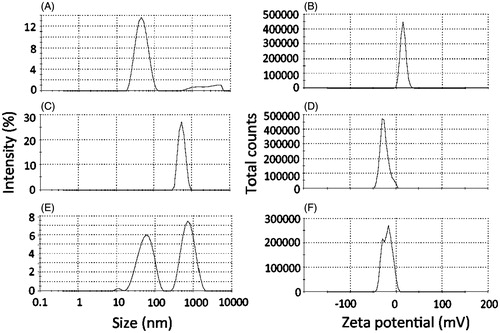
Figure 3. Irritation potential and toxicity of the optimized nanoemulsion. (A) Signs of irritation (coagulation, lysis and hemorrhage) on the chorioallanthoic membrane as a function of time resulting from application of the nanoemulsion in comparison with saline (negative control) and NaOH (positive control); representative images from experiments performed with 4–6 eggs. (B) Survival of Galleria mellonella as a function of time after injection of increasing concentrations of the nanoemulsion (0.5–500 mg/mL). (C) Influence of nanocarrier treatment on the histological characteristics of mammary tissue. The top two panels depict ductal tree staining after intraductal administration of an Evan’s blue solution to demonstrate that the injection is in the correct area; the others represent cross-section of the mammary tissue from untreated animals, or those treated with saline or the unloaded selected nanoemulsion (NE-T). Bar= 50 μm, n = 3–4/group.
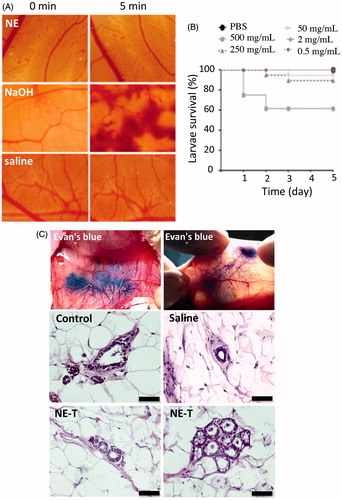
Figure 4. Cytotoxicity of the nanoemulsion (NE) and C6 ceramide. (A) influence of ceramide nanoencapsulation in nanocarriers without (NE) or with tributyrin (NE-T) on the cytotoxicity against MCF-7 cells, (B) influence of tributyrin incorporation and association with ceramide on nanocarrier cytotoxicity against MCF-7 cells; (C) comparison of nanocarrier cytotoxicity with and without ceramide and tributyrin, (D) influence of ceramide nanoencapsulation in nanocarriers without (NE) or with tributyrin (NE-T) on the cytotoxicity against RPE cells. Experiments were performed in triplicate and repeated 3–5 times; data shown as average ± standard error.
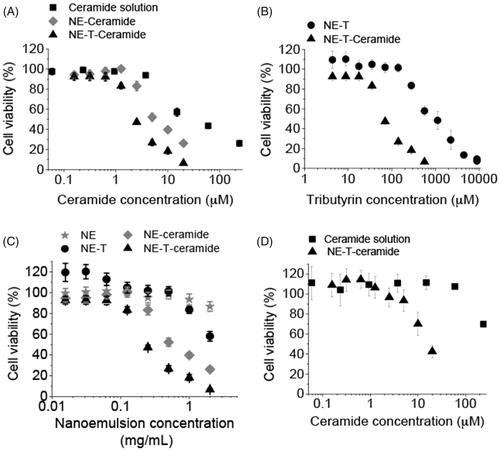
Table 1. Concentrations of C6 ceramide and tributyrin necessary to reduce cell viability to 50% (EC50).
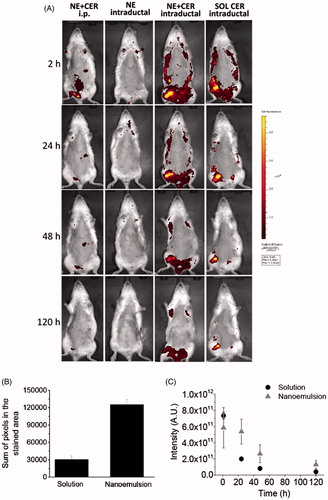
Figure 5. Tissue localization and distribution of C6 ceramide. (A) Representative in vivo whole body images of animals treated with the nanocarrier or a control solution as a function of time; ceramide-loaded nanoemulsion containing tributyrin (NE-T + CER) was administered using the intraperitoneal or intraductal routes. Intraductal administration of the unloaded nanoemulsion was used as control for nanocarrier autofluorescence, whereas ceramide solution was administered intraductally to compare retention time. The figure shows representative images from experiments conducted with 3–4 animals. (B) sum of pixels from the regions stained with C6 ceramide at 120 h post intraductal administration of a ceramide solution or the optimized nanoemulsion. (C) fluorescence decay as a function of time after intraductal administration of a ceramide solution or the optimized nanoemulsion.