Figures & data
Figure 1. Transfection efficacy of DAB-Lf dendriplex at various dendrimer: DNA weight ratios in PC-3 (a) and DU145 cells (b). Results are expressed as the mean ± SEM of three replicates (n = 15). *p < .05 versus the highest transfection ratio.
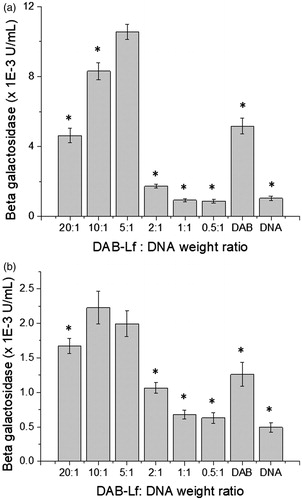
Figure 2. Cellular uptake of fluorescein-labeled DNA complexed with DAB-Lf in PC-3 and DU145 cells: (a) Confocal microscopy imaging of the cellular uptake of fluorescein-labeled DNA (2.5 μg/well) complexed with DAB-Lf, DAB or left uncomplexed, after incubation for 24 h with PC-3 and DU145 cells (Blue: nuclei stained with DAPI (excitation: 405 nm laser line, bandwidth: 415–491 nm), green: fluorescein-labeled DNA (excitation: 543 nm laser line. bandwidth: 550–620 nm), red: Alexa Fluor® 647 probe (excitation: 633 nm laser line, bandwidth: 650–690 nm) (Bar: 10 µm). (b) Flow cytometry quantification of the cellular uptake of fluorescein-labeled DNA (5 µg/well) either complexed with DAB-Lf, DAB or left uncomplexed, after incubation for 24 h with PC-3 cells (n = 5). *p < .05 compared with DAB-Lf-DNA. (c) As in B, but with DU145 cells. (d) Flow cytometry quantification of the PC-3 cellular uptake of fluorescein- labeled DNA (5 µg/well) complexed with DAB-Lf, following pretreatment with free Lf (80 µM) and various cellular uptake inhibitors: phenylarsine oxide (‘PhAsO’), filipin (‘Fil.’), colchicine (‘Colch.’) and poly-L-lysine (‘PLys’) (n = 5), *p < .05 compared with DAB-Lf-DNA. (e) Confocal microscopy imaging of the PC-3 cellular uptake of fluorescein-labeled DNA (2.5 μg/well) complexed with DAB-Lf, following pretreatment with free Lf (80 µM) and various cellular uptake inhibitors: phenylarsine oxide (‘PhAsO’), filipin (‘Fil.’), colchicine (‘Colch.’) and poly-L-lysine (‘PLys’) (Blue: nuclei stained with DAPI (excitation: 405 nm laser line, bandwidth: 415–491 nm), green: fluorescein-labeled DNA (excitation: 543 nm laser line. bandwidth: 550–620 nm), red: Alexa Fluor® 647 probe (excitation: 633 nm laser line, bandwidth: 650–690 nm) (Bar: 10 µm). (f) As in d, but with DU145 cells (g) As in e, but with DU145 cells.
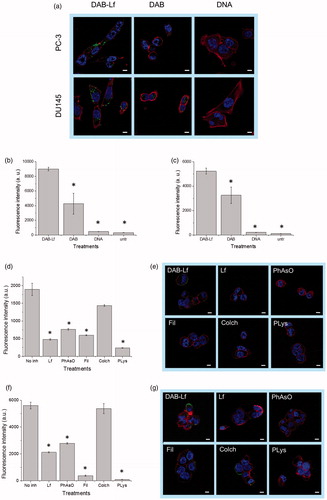
Table 1. Antiproliferative efficacy of DAB-Lf dendriplexes encoding TNFα, TRAIL, and IL-12, expressed as IC50 values, in PC-3 and DU145 prostate cancer cells (n.d.: not determined) (n = 15).
Figure 3. (a) Tumor growth studies in a PC-3 xenograft model after intravenous administration of DAB-Lf dendriplex encoding TNFα (▪, green), TRAIL (•, red), IL-12 (▲, blue) (50 µg DNA/injection), DAB-Lf (▼, brown), naked DNA encoding TNFα (▪, pale green), naked DNA encoding TRAIL (•, orange), naked DNA encoding IL-12 (▲, cyan), untreated tumors (•, back) (n = 5). (b) Variations of the animal body weight throughout the treatment (Color coding as in a) (n = 5). (c) Overall tumor response to treatments at the end of the study, classified in accordance with the Response Evaluation Criteria in Solid Tumors (RECIST) (Eisenauer et al., Citation2009) (red: progressive response, orange: stable response, yellow: partial response, green: complete response) (n = 5). (d) Time to disease progression. The Y axis gives the proportion of surviving animals over time. Animals were removed from the study once their tumor reached 10 mm diameter (Color coding as in a) (n = 5).
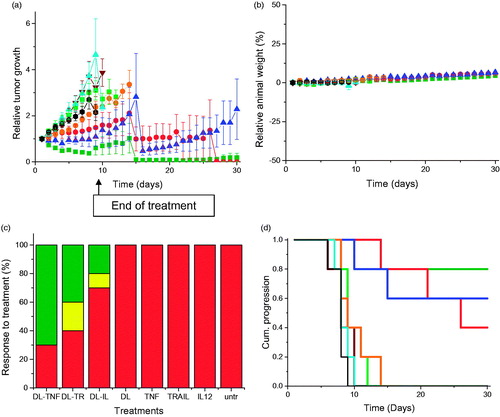
Figure 4. As in Figure 3, but in DU145 cells.
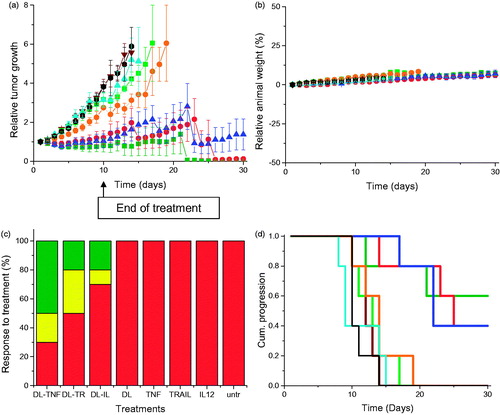
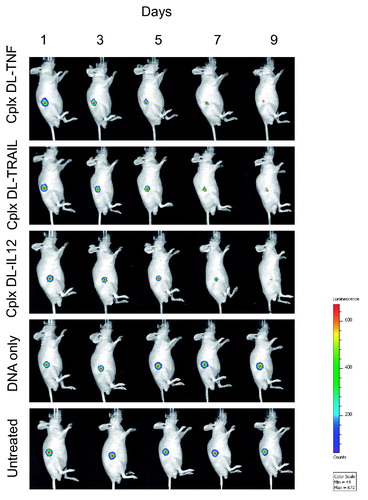
Figure 5. Bioluminescence imaging of the tumoricidal activity of DAB-Lf dendriplex encoding TNFα (‘cplx DT-TNF’), TRAIL (‘cplx DT-TRAIL’), IL-12 (‘cplx DT-IL12’) in a PC-3 M-luc-C6 tumor model. Controls: naked DNA and untreated tumors. The scale indicates surface radiance (photons/s/cm2/steradian).