Figures & data
Table 1. Structures and properties of piperazine chitosans used in the study.
Figure 1. siRNA complexation by piperazine substituted chitosans. (A) EtBr displacement assays of piperazine substituted chitosans with siRNA. Polymers and EtBr containing siRNA solutions in 10 mM Tris-HCl buffer pH 7.4 mixed at specified at monomeric unit: nucleotide ratio; fluorescence level expressed as a% of the initial relative fluorescence of the EtBr siRNA complex (n = 3). (B) Agarose gel electrophoresis. The upper image shows the migration of free polymer, and the lower image shows the migration of free siRNA. The bands were visualized as described in the Methods section. Lane 1: siRNA control; lanes 2–9: polymer:siRNA complexes at ratios 0.25, 0.5, 0.75, 1.0, 1.25, 1.5, 2.0, and 5.0 to 1; lane 10: polymer control. Polymers: gel a shows MQ1-46; b: MQ4-42; c: NQ30; and d: DQ39.
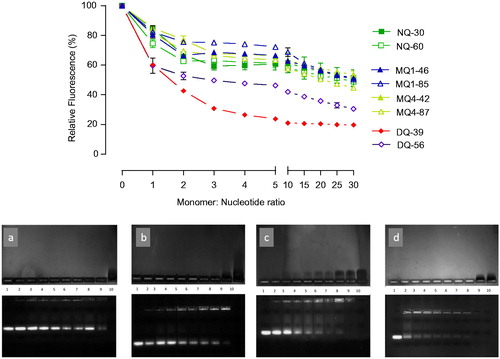
Figure 2. siRNA silencing with piperazine chitosan siRNA complexes. (A) Piperazine chitosan silencing of GAPDH in H1299 cells by siRNA complexes with different piperazine chitosan derivatives. Complexes (100 nM siRNA) were prepared at a 5:1 monomer:nucleotide ratio and incubated with cells in serum free RPMI-1640 medium for 4 hours and analysis performed 44 hours after complexes removal and cells incubation in fresh RPMI-1640 medium containing serum. GAPDH levels were evaluated using the KDalert GAPDH kit (Ambion) and expressed as the % GAPDH reduction relative to expression in untreated control cells. Data shown as the mean ± SD (n = 6). ***p < .001. (B) A549-luc cellular survival in vitro. A549-luc cells were seeded in a 96-well plate at a density of 104 cells/well. EGFR-siRNA or negative control siRNA complexes with DQ39 (100 nM siRNA) were incubated with cells in serum-free medium for 4 hours. Samples were then removed and replaced with fresh serum-containing growth medium. Cells were incubated for a further 24, 48, or 72 hours after which cell survival was measured by an MTS assay. Doxorubicin (5 µM) was incubated with cells for 24, 48, or 72 hours. Doxorubicin was used at the IC50 concentration (5 µM) as established for 48 hr incubation in the previous experiment. Results are shown as the mean ± SD (n = 8).
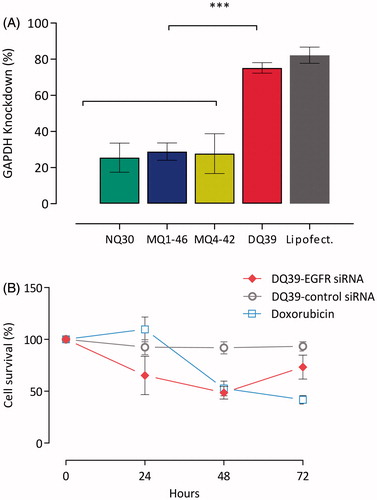
Figure 3. Typical droplet size analyses and spray pattern of DQ39-siRNA complexes sprays obtained by microsprayer (PennCentury™) and biodistribution of DY647-labeled DQ39-siRNA complexes in the lung following microsprayer administration to mice. Spray pattern analysis (top images) used Para Red dye added to the buffer for visualization purposes. Droplet size data (table) reported as volume diameter defined by 10%, 50%, and 90% (volume median) of the cumulative volume undersize (Dv10, Dv5, and Dv90, respectively). Data is given as the mean ± SD (n = 3). Ovality was calculated as the ratio of maximum vs. minimum diameter, average of three sprays, as illustrated. Bottom images illustrate IVIS analysis of excised lung following application by a microsprayer of DY647-labeled siRNA complies with DQ39 formulated at 5:1 ratio at siRNA concentration of 10 µg/50 µl. Mice were dosed with siRNA complexes (10 µg siRNA in 50 µl) and images of obtained by IVIS imaging immediately after administration.
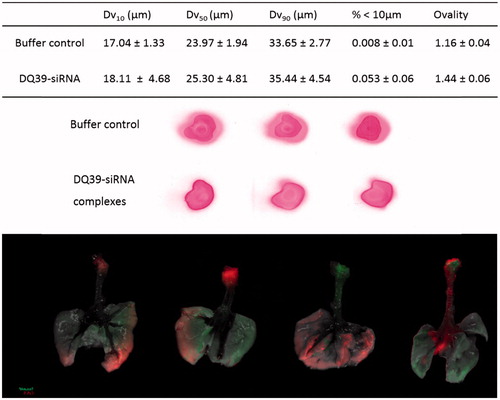
Figure 4. Tumour growth inhibition by EGFR-siRNA complexes with DQ39 piperazine-substituted chitosan. Images show luciferase bioluminscence of A549Luc cells assessed by whole animal bioluminescent imaging (IVIS) of DQ39-(negative control)-siRNA (upper images) and DQ39-(EGFR)-siRNA complexes (lower images) at day −8, −1, 6, 13, 22, 27, and 34 of the treatment. IVIS images following one selected mouse per group are shown. Graph shows mean bioluminescent intensity relative to pretreatment values.
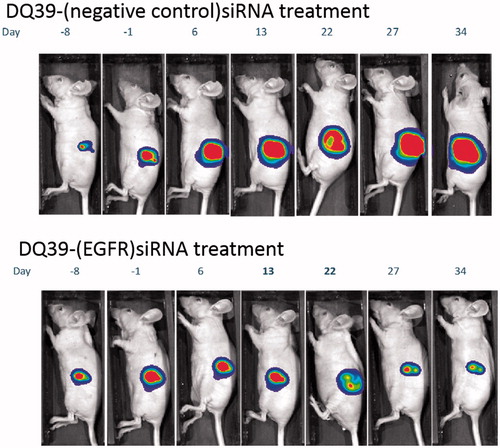
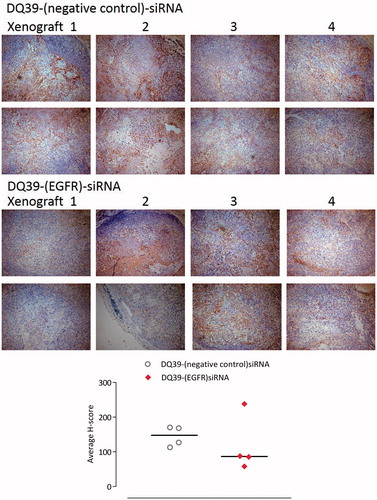
Figure 5. Mouse xenograft models stained for EGFR. Samples of A549Luc xenograft mouse models excised at the final time point. Four xenograft samples from each treatment group were stained for EGFR (two images of different fields of view shown for each xenograft). Images taken with a Leica DM4000B light microscope at ×10 magnification. Areas expressing EGFR are stained brown (darker regions in black and white copy). Graph shows H-scoring data, as explained in the experimental section.