Figures & data
Figure 1. Quantification of BEZ. (A) The UV absorbance spectrum showed an absorbance peak at 325 nm. (B) The fluorescence spectrum showed an emission peak at 425 nm when BEZ solution was excited at 325 nm.
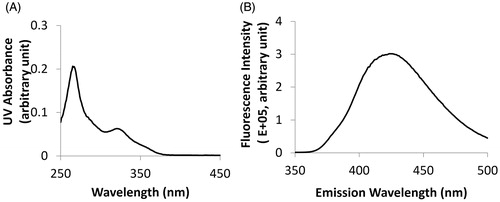
Figure 2. Cytotoxicity of BEZ and L-BEZ. The IC50 values of BEZ and L-BEZ were 0.1 and 0.3 µM, respectively, on Hep3B cells by MTT assay. Untreated cells were also tested and the viability was 100% for both groups.
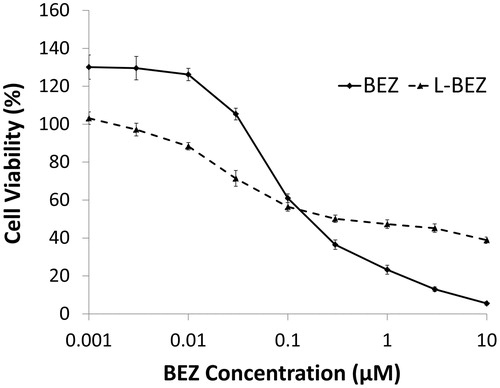
Figure 3. Effect of Electroporation and L-BEZ on Cells. (A) Cell viability after electroporation at different field strengths. More cells were viable after electroporation at 250 V/cm than with no electroporation. (B) Cell viability after treatment with IRE in combination with L-BEZ at various intervals. Combination therapy (abbreviated as C) is BEZ or L-BEZ following IRE treatment at 1600 V/cm, 100 ms, and 99 pulses to the cell. The time interval between IRE and BEZ or L-BEZ treatment is indicated (t = −3, 0, and +1.5 min, respectively).
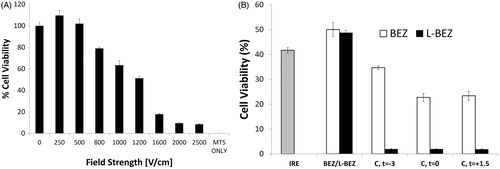
Figure 4. Tumor necrosis three days after treatment. Representative H&E stained tumor sections from the (A) control group; (B) L-BEZ group; (C) IRE group; and (D) IRE + L-BEZ group. The tumors treated with IRE and IRE + L-BEZ had higher mean necrosis percentages than did the tumors in the other groups. The insets in (C) and (D) illustrate that live tumor cells were found within the margin of the tumors, while the necrotic cells were found in the center of the electroporated area. No living cells were observed in the IRE + L-BEZ-treated tumors. Tumor size at the start of the treatment: IRE, 11.6 × 10.6 mmand IRE + L-BEZ, 11.3 × 11.4 mm. (E) Comparison of percentage of necrosis by H&E staining (one-way ANOVA followed by Holm-Šidák post-hoc analysis, p values between: CTL and LBEZ, .094; CTL and IRE, <.001; CTL and IRE + LBEZ, <.001; LBEZ and IRE, <.001; LBEZ and IRE + LBEZ, <.001; and IRE and IRE + LBEZ, .185).
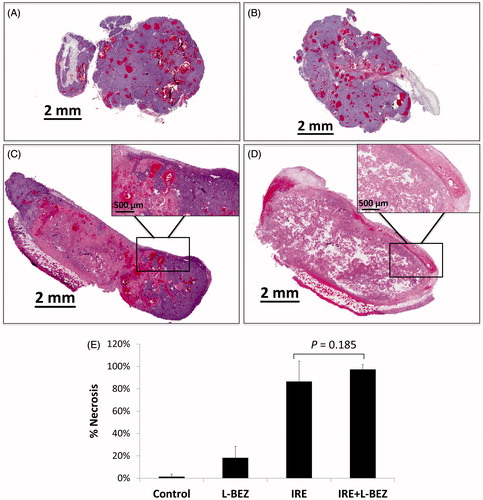
Figure 5. Tumor apoptosis three days after treatment using TUNEL Staining. Representative tumor sections from the (A) control group; (B) L-BEZ group; (C) IRE group; and (D) IRE + L-BEZ group. The tumors treated with IRE and IRE + L-BEZ had higher mean apoptosis percentages than did the tumors in the other groups. The insets in (C) and (D) illustrate that the dark apoptosis-positive signal was not confined in the nuclei but spread out to the cytosol and in some intratumoral space. (E) Comparison of percentage of apoptosis by TUNEL staining (one-way ANOVA followed by Holm-Šidák post-hoc analysis, p values between: CTL and LBEZ, .671; CTL and IRE, < .001; CTL and IRE + LBEZ, <.001; LBEZ and IRE, <.001; LBEZ and IRE + LBEZ, <6.001;and IRE and IRE + LBEZ, .726).
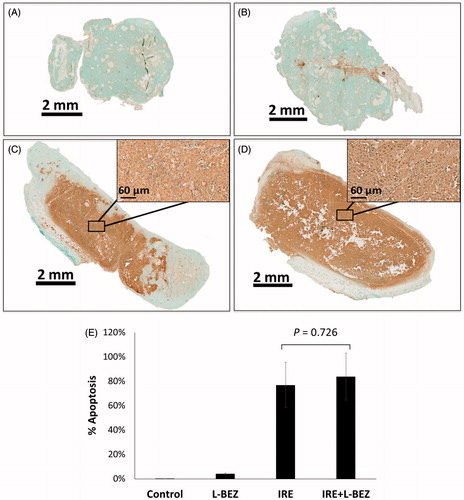
Figure 6. Ki-67 staining. Representative Ki-67- stained images of the center of the (A) control group; (B) L-BEZ group, showing nonproliferating cells near the injection route; C) IRE group, showing a marked decrease in the number of proliferating cells; and (D) IRE + LBEZ group, showing a marked decrease in the number of proliferating cells. (E) Comparison of the percentage of Ki-67–positive proliferating cells in the different treatment groups (one-way ANOVA followed by Holm-Šidák post-hoc analysis, p values between: CTL and LBEZ, .886; CTL and IRE, .086; CTL and IRE + LBEZ, .005; LBEZ and IRE, .091; LBEZ and IRE + LBEZ, .005; and IRE and IRE + LBEZ, .081).
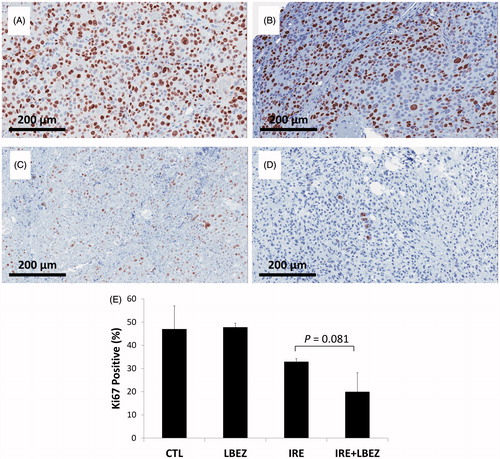
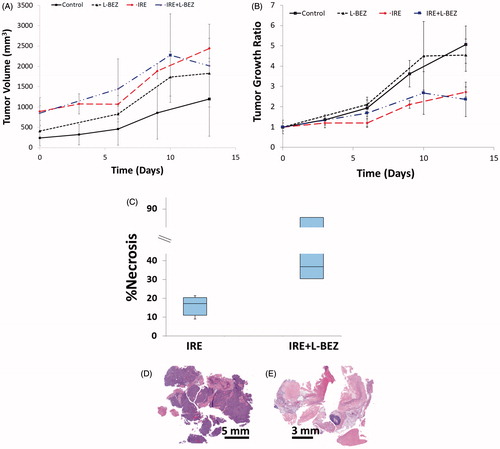
Figure 7. In Vivo antitumor effect of IRE in combination with chemotherapy on nude mice bearing Hep3B xenografts After one treatment. (A) Tumor size over time. (B) Tumor growth ratio over time. Both the IRE and IRE + L-BEZ groups had significantly lower tumor burden than did the control group (one-way ANOVA, p < .05). No statistically significant difference was observed between the IRE and IRE + L-BEZ groups (n = 4 mice per group) (C) Percentage of necrosis as quantified by H&E staining two weeks after one treatment. The median percentage necrosis of combination treatment with IRE + L-BEZ doubled that of IRE treatment alone. Representative H&E-stained slides of tumor treated with IRE alone (D), or IRE + L-BEZ (E). Notice the extent of necrosis exhibited in the tumor treated with the combination therapy compared to that in the tumor treated with IRE alone.