Figures & data
Table 1. The starting conditions of PYM liposomes before embedding in thermogels.
Table 2. Factors and responses in Box–Behnken design.
Table 3. Observed responses for the Box–Behnken design..
Table 4. Fit summary for responses Y1, Y2 and Y3.
Table 5. The analysis of variance for responses Y1, Y2 and Y3.
Figure 1. Perturbation plots showed the effects of X1 (A), X2 (B) and X3 (C) on the responses Y1 (a), Y2 (b) and Y3 (c). X1 is the factor of drug loading of the preparation, X2 is the factor of CS amount, X3 is the factor of GP content, Y1 is the response of cumulative release percentage of PYM in 1 day, Y2 is the response of cumulative release percentage of PYM in 9 days, Y3 is the response of rate constant k.
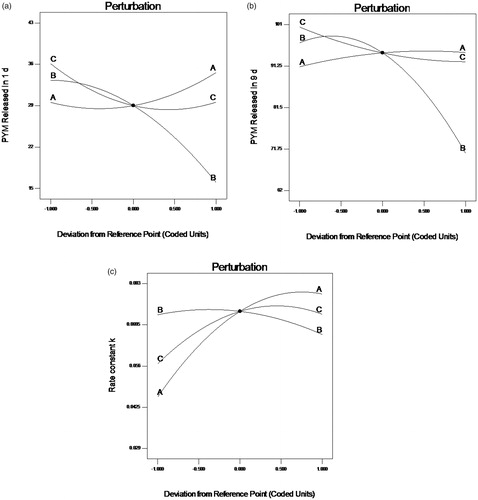
Figure 2. (a–i) Contour plots showed the effects of X1(A), X2(B) and X3(C) on the response Y1, Y2 and Y3. X1 is the factor of concentration of PYM, X2 is the factor of CS amount, X3 is the factor of GP content, Y1 is the response of cumulative release percentage of PYM in 1 day, Y2 is the response of cumulative release percentage of PYM in 9 days, Y3 is the response of rate constant k.
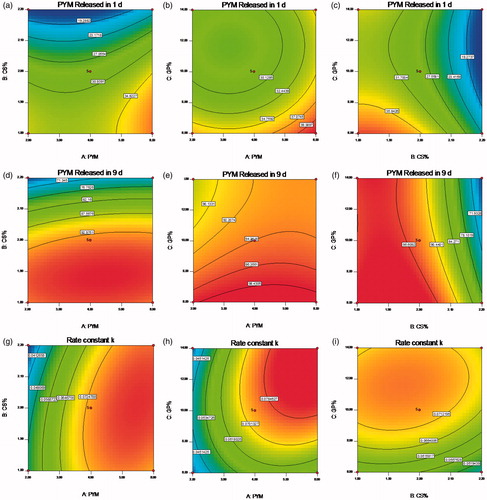
Figure 3. (a–i) Response surface plots showed the effects of X1(A), X2(B) and X3(C) on the response Y1, Y2 and Y3. X1 is the factor of concentration of PYM, X2 is the factor of CS amount, X3 is the factor of GP content, Y1 is the response of cumulative release percentage of PYM in 1 day, Y2 is the response of cumulative release percentage of PYM in 9 days, Y3 is the response of rate constant k.
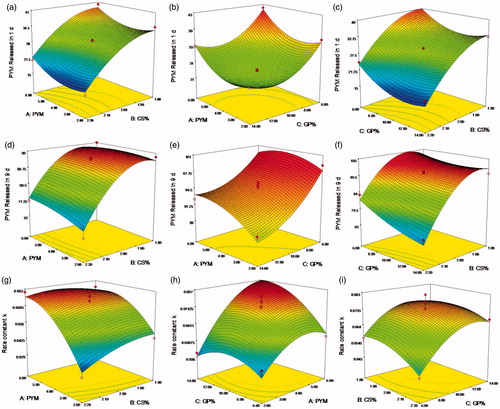
Figure 4. PYM in vitro release profile from PYM liposomes, PYM thermogels and PYM liposomal thermogels (n = 3).
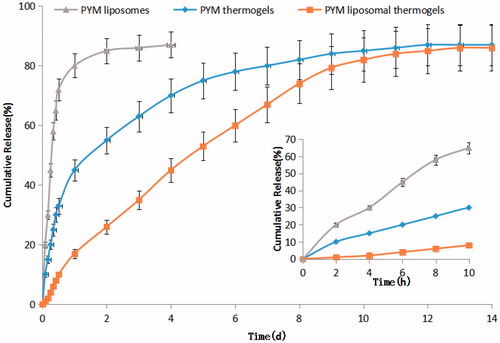
Table 6. The predicted and experimental response values of the optimized formulations.
Figure 5. Morphological changes of EA.hy926 cells exposed to blank liposomal thermogels, PYM liposomes and PYM liposomal thermogels for 24 h. Cells were stained by H&E and fluorescent dye, respectively.
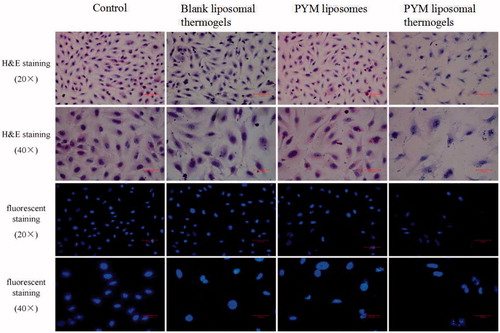
Figure 6. Effects of PYM on EA. hy926 in vitro treated with (a) control, (b) blank liposomal thermogels, (c) PYM liposomes(1 μg/mL), (d) PYM liposomal thermogels (1 μg/mL) for 24 h, discriminated by FITC-annexin V & PI.
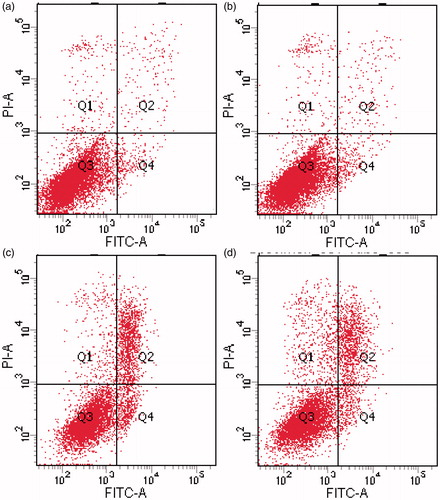
Table 7. Effects of PYM liposomes, PYM liposomal thermogels and blank liposomal thermogels on the cell cycle of EA.hy926 (n = 3,10 μg/mL,24 h).
Table 8. Apoptosis rate & Necrosis rate of EA.hy926 in vitro treated with blank liposomal thermogels, PYM liposomes and PYM liposomal thermogels (n = 3, 1 μg/mL & 10 μg/mL, 24 h & 48 h).
Figure 7. Mean blood concentration–time curve of PYM in rabbits after administration of PYM liposomes, PYM thermogels and PYM liposomal thermogels (Each value represents the mean ± SD, n = 6).
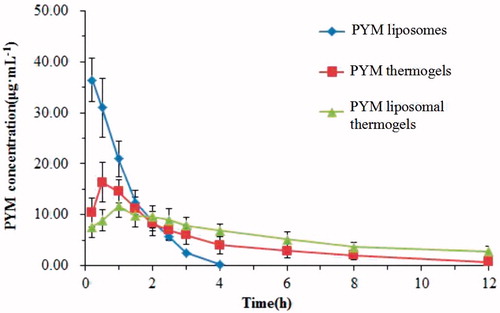
Table 9. Pharmacokinetic parameters of PYM liposomes, PYM thermogels and PYM liposomal thermogels.
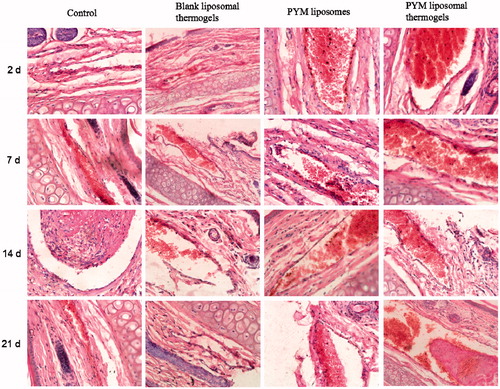
Figure 8. Histological sections of rabbit ear veins after administration of normal saline solutions, blank liposomal thermogels, PYM liposomes and PYM liposomal thermogels for 2, 7, 14, 21 days (40×).