Figures & data
Table 1. Experimental groups (n = 8 mice) for bone repair and mineralization rate evaluation.
Figure 1. 125I-BMP-2 and 125I-MMP10 (%) remaining at the implantation site after injection of free125I-MMP formulation (S-125I-MMP) and after injection of the microsphere systems M-125I-MMP and M-125I-BMP into the calvaria defects in mice.
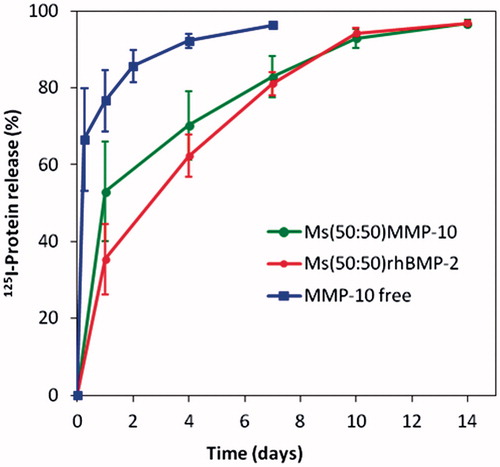
Figure 2. Representative images of the defect in the different experimental groups at 4 and 8 weeks post-implantation. Photomicrographs of horizontal sections of the calvarial defects implanted with systems loaded with 100, 300 and 600 ng of BMP-2 in microsphere and the systems containing a combination of BMP-2 and MMP-10 in microspheres: 600 ng of BMP-2:3 ng of MMP10 (ratio 200:1) and 600 ng of BMP-2: 30 ng of MMP10 (ratio 20:1). Arrowheads in the different images indicate active areas of osteosynthesis in the defect margins. B: host bone; BMa: bone marrow; CT: connective tissue; DS defect site; NB: newly formed bone; Ms: microspheres. Scale bar 1 mm.
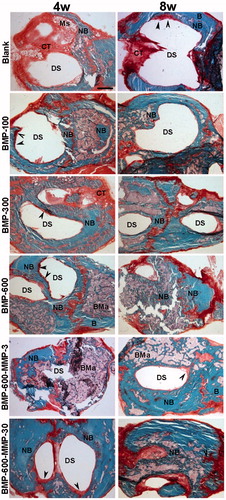
Figure 3. Histomorphometrical analysis. Comparison of the percentages of repair (%) among the different experimental groups at different experimental time points. Data presented as means ± SD. The identical letter on different bars indicates significant differences (n = 4), p < .05.
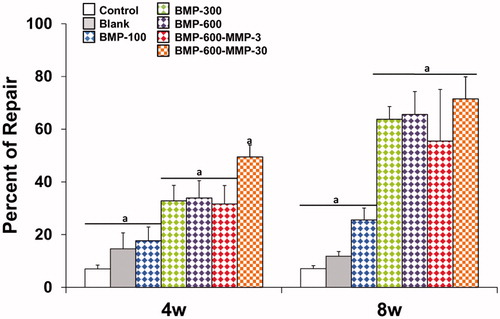
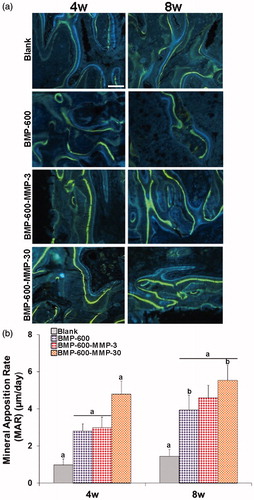
Figure 4. Mineral apposition rates determined in histological specimens from mouse calvaria at 4 and 8 weeks post-implantation in all the experimental groups. (a) Fluorochrome labeling (tetracycline and calcein) of the mineralization front. Doses were given 12 and 4 days prior to euthanasia and inter-label thickness was determined by image analysis to calculate the mineral apposition rate. Scale bar: 50 µm. (b) Quantification of mineral apposition rates within the ROI of all experimental groups. Data presented as means ± SD. The identical letter on different bars indicates significant differences (n = 4), p < .05.