Figures & data
Figure 1. Killer NPs treatment markedly prolongs alloskin graft survival. (A) Kaplan–Meier survival plots for alloskin grafts in the bm1 mice grafted with ear skin of B6 mice. Recipient mice were randomized into 8 groups and injected via tail vein with 200-nm killer NPs or control NPs on days 9, 11 and 13 after skin transplantation. (B) Kaplan-Meier survival plots for alloskin grafts in the bm1 mice grafted with ear skin of BALB/c mice, a third-party alloskin transplant model followed by i.v. injection with 200-nm Killer NPs, Blank NPs, or PBS on days 5, 7 and 9 post-transplantation. (C) Kaplan-Meier survival plots for alloskin grafts in the bm1 mice grafted with ear skin of B6 mice. Recipient mice were injected via tail vein with 80-nm killer NPs, NPKb/aFas/PD-L1/TGFβ, Blank NPs or PBS on days 9, 11 and 13 after transplantation. *p < .05, **p < .01, ***p < .001.
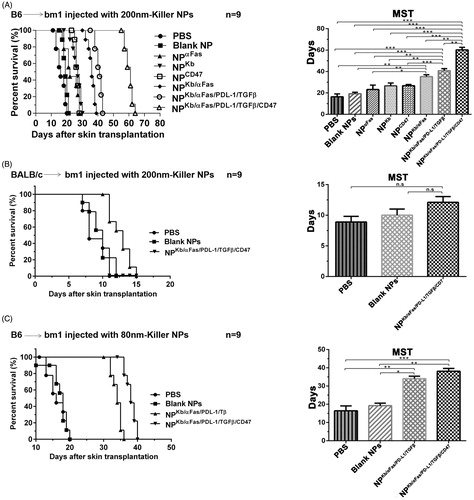
Figure 2. Killer NPs treatment markedly reduces the local allo-rejections of alloskin graft. (A) In-situ H-2Kb-Ig dimer fluorescence staining. (B) IHC staining. (C) H&E staining. Representative images from 3 to 5 individual mice were selected. **p < .01, ***p < .001.
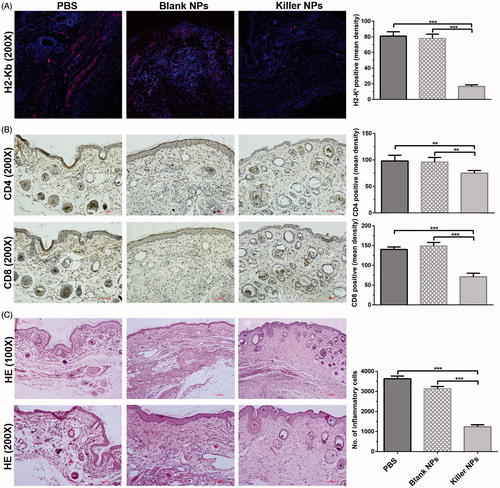
Figure 3. Killer NPs treatment depletes H-2Kb alloantigen-reactive CD8+ T cell, enhances the apoptosis of CD8+ T cells and inhibits the donor-specific alloreactivity of recipient T cells. (A) Frequencies of H-2Kb alloantigen-reactive CD8+ T cell in the spleens and PMBCs. The percentage of H-2Kb-Ig dimer+/CD8+ cells was calculated in the CD8+/CD3+ cell population. (B) Apoptosis of CD8+ T cells in spleen and PBMCs. (C) Anti-donor MLR assays. Splenocytes from recipient bm1 mice were labeled with CSFE first and co-cultured with the Mitomycin C-treated splenocytes from donor B6 mice for 7 days. The proliferation of recipient’s CD3+ T cells was determined according to cell division. Data were presented as mean ± SD. n = 3 or 4 mice in each group. *p < .05. **p < .01, ***p < .001.
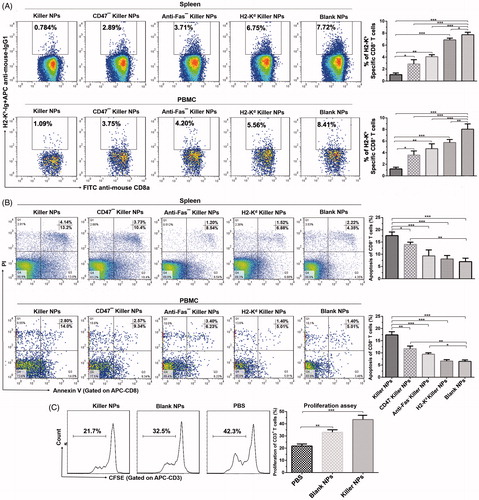
Figure 4. Killer NPs treatment induces the regulatory T cells and inhibits the activation of CD8+ T cells. (A, B) Tregs in spleen and lymph nodes. (C) Activation of CD8+ T cells in spleen. Data were presented as mean ± SD. n = 3 or 4 mice in each group. *p < .05. **p < .01, ***p < .001.
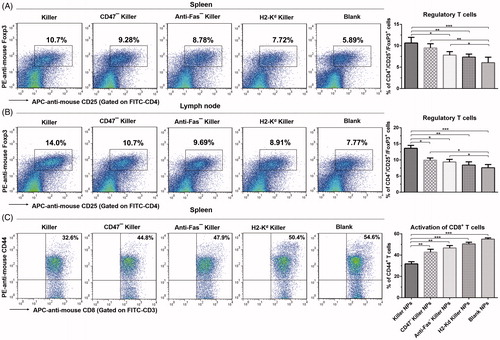
Figure 5. In vivo tracking and tissue distribution of killer NPs. ICG-encapsulated killer NPs, H2-Kb− killer NPs, CD47− killer NPs or blank NPs were i.v. administered to recipient bm1 mice on day 9 after skin transplantation. (A) Whole-body in vivo imaging (left panel) and ex vivo imaging for the excised organs at 2 h after injection (right panel). (B) The localization of killer NPs in alloskin grafts by whole-body fluorescence imaging. (C) PE-labeled killer NPs presented in peripheral blood, spleen and lymph nodes at indicated time points as detected by flow cytometry.
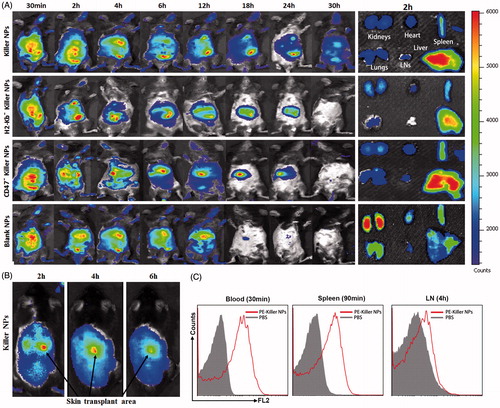
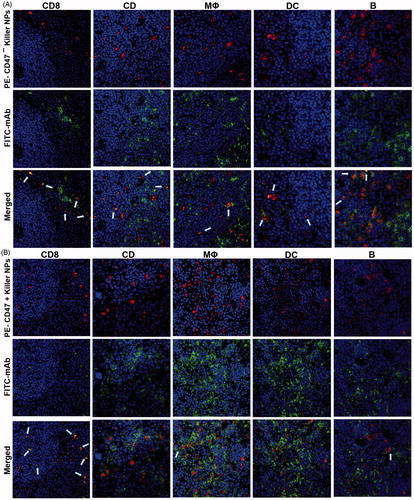
Figure 6. Confocal fluorescence imaging for the co-localizations of killer NPs with immune cells in spleen sections. On day 9 after skin transplantation, PE-coupled CD47+ and CD47− killer NPs were i.v. injected, respectively, into recipient bm1 mice, and spleens were harvested in dark after 3 h. The frozen sections were stained with FITC-labeled mAbs specific for CD8+ T cells, CD4+ T cells, macrophages, dendritic cells, or B cells. Confocal photomicrographs of the immune cells with PE-CD47− killer NPs (A) and PE-CD47+ killer NPs (B) were presented, respectively, at 400 × magnification.