Figures & data
Figure 1. Size distribution of SLNs/PD (A) and HA-SLNs/PD (B) based on dynamic light scattering. (C) Encapsulation efficiency and drug loading yield of SLNs/PD and HA-SLNs/PD (n = 3). (D) Transmission electron micrographs of HA-SLNs/PD. Bar, 100 nm. (E) In vitro stability of HA-SLNs/PD at 4 °C or 37 °C (n = 3). (F) In vitro cumulative PD release profiles of free PD, SLNs/PD and HA-SLNs/PD at 37 °C in PBS (pH 7.4) (n = 5).
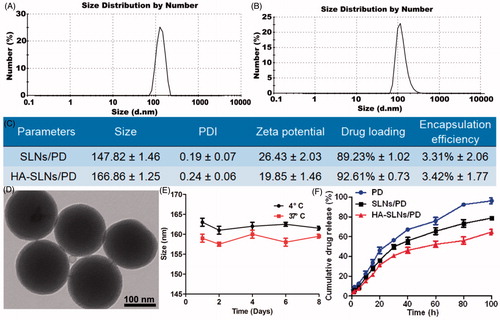
Figure 2. HPLC analysis showing uptake of SLNs/PD or HA-SLNs/PD in Raw264.7 cells with or without LPS (100 ng/mL) activation (mean ± SD, n = 3). *p < .05.
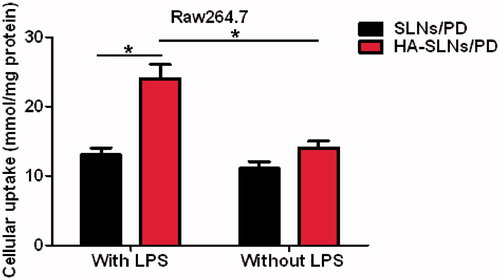
Figure 3. In vivo biodistribution of free PD, SLNs/PD and HA-SLNs/PD in mice with collagen-induced arthritis. Mice were injected with either preparation via the tail vein and sacrificed at 0.5, 1, 2 and 4 h afterwards. Samples of plasma, heart, liver, spleen, lung, kidney, and joints were immediately collected and analyzed by HPLC. Data shown are mean ± SD (n = 5). *p < .05 vs mice treated with free PD or SLNs/PD.
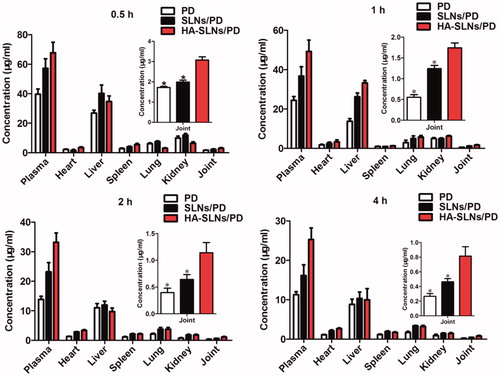
Figure 4. Concentration-vs-time curves (A) and pharmacokinetic parameters (B) of PD, SLNs/PD and HA-SLNs/PD in joints after intravenous injection into arthritis mice (n = 5).
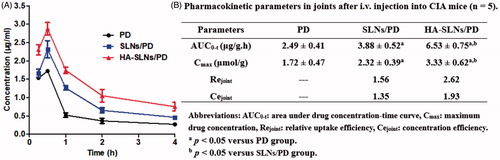
Figure 5. Concentration-vs-time curves (A) and pharmacokinetic parameters (B) of PD, SLNs/PD and HA-SLNs/PD in plasma after intravenous injection into arthritis mice (n = 5).
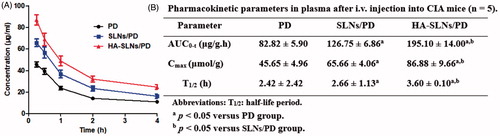
Figure 6. Therapeutic efficacy of HA-SLNs/PD in vivo. (A) Body weight in different treatment groups. Data are mean ± SD (n = 5). (B) Mean arthritis scores were calculated for the joints in the right hind limb following different treatments. Data shown are mean ± SD (n = 5). (C) Photomicrographs of histological sections of ankle joints from animals after different treatments. Arrows indicate finger-like pannus formation; asterisks, bone destruction. Bar, 100 nm.
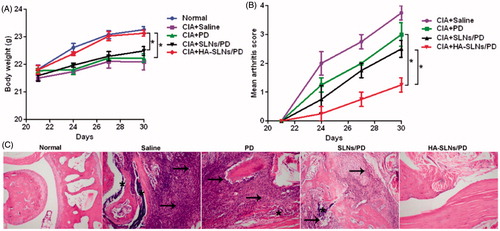
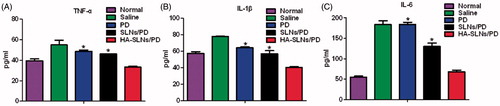
Figure 7. Production of pro-inflammatory cytokines in arthritic mice treated with saline, free PD, SLNs/PD, or HA-SLNs/PD. Healthy, untreated animals served as a control (Normal). Serum levels of (A) TNF- α, (B) IL-1β, and (C) IL-6 were assayed. Data shown are mean ± SD (n = 5). *p < .05 vs animals treated with free PD or SLNs/PD. CIA, mice with collagen-induced arthritis.