
Figures & data
Table 1. The independent variables, their respective levels, and the model summary statistics of 41.21 full factorial design used for optimization of DCN elastosomes.
Figure 1. Response 3D plots for the effect of type of EA (X1) and amount of EA (X2) on (A) entrapment efficiency percentage (EE%), (B) particle size (PS), (C) polydispersity index (PDI), (D) zeta potential (ZP), and (E) deformability index (DI) of DCN elastosomes.
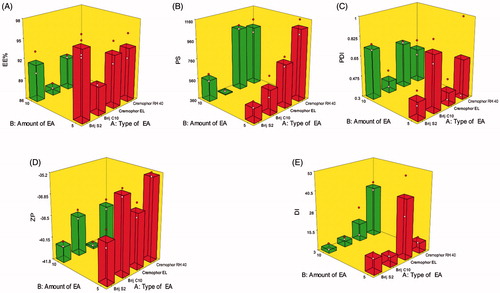
Table 2. Experimental runs, independent variables, and measured responses of the 41.21 full factorial experimental design of DCN elastosomes compared to DCN-loaded bilosomes (A) and the observed and predicted values of the optimal elastosomes (E1) (B).
Figure 2. The release profiles of DCN from the prepared eight elastosomal formulations (A). The size distribution curve (B), transmission electron micrograph (C) of E1 and DSC thermograms of (i) DCN, (ii) CH, (iii) Span 60, (iv) STC, (v) Brij S2, (vi) physical mixture of DCN with elastosomal components and (vii) E1 (D).
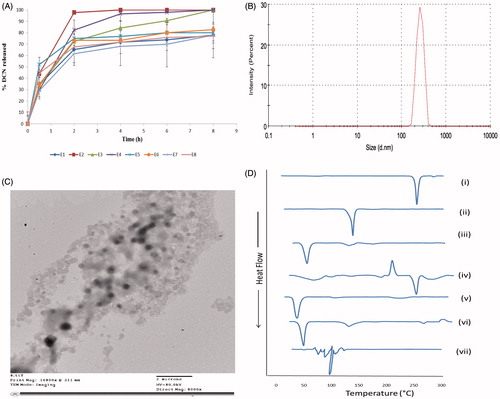
Figure 3. Ex-vivo permeation profiles (A), in-vivo skin deposition plot (B) of DCN from E1, DCN-loaded bilosomes and DCN suspension after topical application (*p < .05). Photomicrographs showing histopathological sections (stained using hematoxylin and eosin) of normal untreated rat skin (group I) and rat skin treated with E1 (group II) (C). (i)–(iii) denote the magnification power of 16× to illustrate all skin layers, 40× to identify the epidermis and dermis, and 40× to identify the subcutaneous tissue and muscles, respectively. Abbreviations: epidermis (p), dermis (d), hair follicles (f), subcutaneous tissue (sc), and muscle (m). Mean rhein plasma-concentration time curves (D), release profiles (E), and multiple level C IVIVC between AUC0→t for 2, 4, and 6 h and percentage DCN released at these time points (b = 0.22; R = 0.976 and b = 0.21; R = 0.984 for E1 and DCN oral suspension, respectively) (F) for E1 and DCN oral suspension.
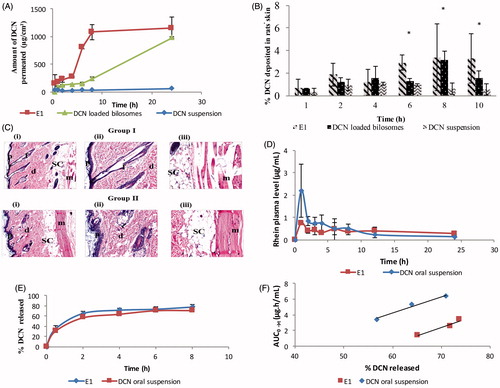
Table 3. Skin permeability parameters of DCN after topical application of E1, DCN-loaded bilosomes, and drug suspension (A) and pharmacokinetic parameters of E1 in comparison with DCN oral suspension (B).