Figures & data
Figure 1. (A) Design of the albumin-conjugated PTX prodrugs; (B) Synthetic routes of PL1, PSL1, and PSSL1.
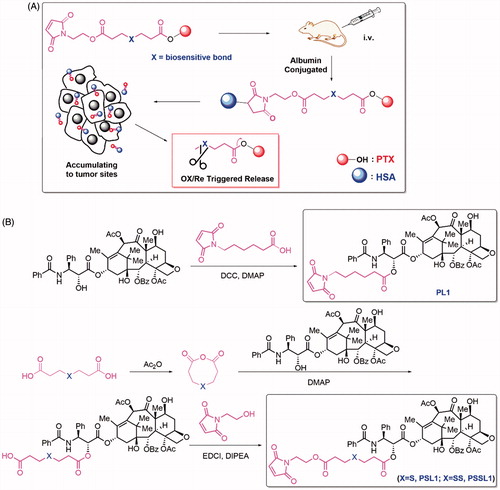
Figure 2. Cumulative release of PTX from the three prodrugs under different conditions. (A) PL1 in PBS, 10 mM H2O2, and 10 mM DTT; (B) PSL1 in PBS, 10 µM H2O2, and 10 mM H2O2; (C) PSSL1 in PBS, 10 µM DTT, and 10 mM DTT.
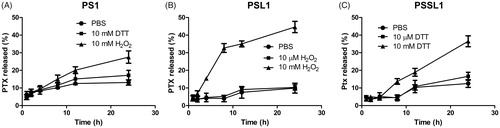
Figure 3. Cell inhibition with various concentrations of PTX solution, PL1, PSL1, and PSSL1 in (A) PC-3 cells, (B) KB cells, and (C) 4T1 cells after 48 h of treatment.
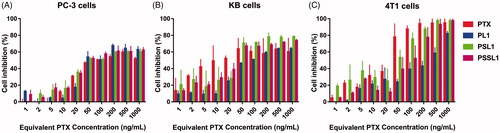
Figure 4. Cellular uptake of PTX after treatment with 1 and 5 µg concentration PTX, PL1, PSL1, and PSSL1 at (A) 1 (B) 4, and (C) 8 h, respectively.
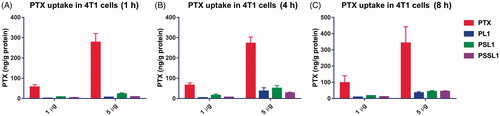
Figure 5. Biodistribution of PTX in 4T1 xenograft tumor-bearing BALB/c mice at (A) 4 and (B) 24 h (n = 3). (C) Fluorescent distribution of IR-820 and IR820-maleimide at 2, 8, 24, and 48 h, respectively. (D) Calculated fluorescent efficiencies of IR820-maleimide in the main organs and tumors at 2, 8, 24, and 48 h, respectively.
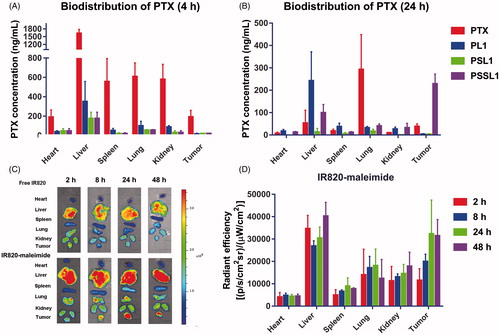
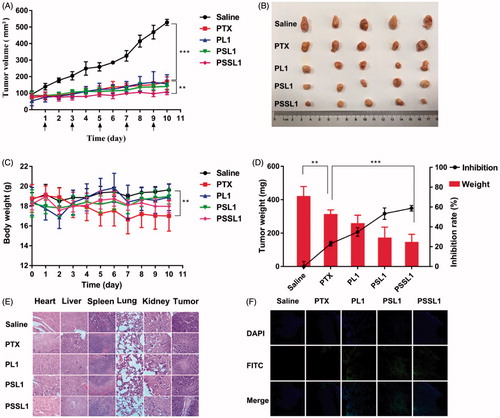
Figure 6. In vivo antitumor efficiencies of PTX, PL1, PSL1, and PSSL1 in 4T1 xenograft tumor-bearing BALB/c mice. (A) Changes in tumor volume; (B) Photographs of tumors after the last treatment; (C) Body weight variations; (D) Yumor weights and inhibition rates of tumor growth at the end of experiment; (E) H&E staining results of the main organs and tumors after treatment with saline, PTX, PL1, PSL1, and PSSL1; (F) TUNEL assay of tumor sections after treatment with different drug formulations.