Figures & data
Figure 1. The particle size distribution and morphology of ACGs-NSps. (A) The particle size of FA-PEG-ACGs-NSps and PEG-ACGs-NSps measured by DLS. (B) TEM micrograph of FA-PEG-ACGs-NSps. (C) TEM micrograph of PEG-ACGs-NSps.
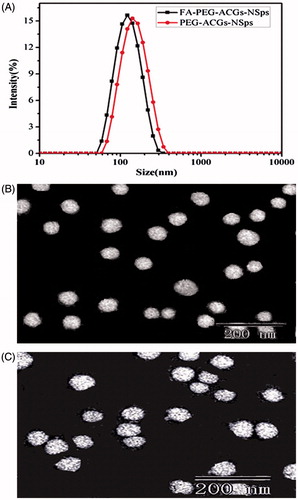
Figure 2. The stability and in vitro cumulative release profiles of ACGs-NSps. Particle size change of FA-PEG-ACGs-NSps (A) and PEG-ACGs-NSps (B) in 0.9% NaCl, 5% glucose, PBS, and plasma at 37 °C (n = 3, mean ± SD). (C) The in vitro cumulative release profiles of ACGs from FA-PEG-ACGs-NSps at 37 °C in pH 7.4 PBS. Notes: The amount of ACGs released from NSps was estimated by the reduction of quantity inside the dialysis bag with the HPLC method. All data are represented as mean ± SD (n = 3).
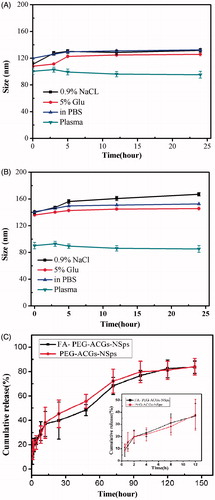
Figure 3. In vitro antiproliferative activity and in vivo antitumor experiments on HeLa tumor-bearing mice. (A) Cytotoxicity of ACGs solution, PEG-ACGs-NSps, FA-PEG-ACGs-NSps, FA + PEG-ACGs-NSps, and FA + FA-PEG-ACGs-NSps against HeLa cells (a) and A549 cells (b) for 24 h using MTT assay. All data are represented as mean ± SD (n = 6). (B) (a) The growth of relative tumor volume over time of PTX injections, PEG-ACGs-NSps, and FA-PEG-ACGs-NSps; (b) the average body weight change of mice along with time. All data are represented as mean ± SD. *p < .01, **p < .001 with FA-PEG-ACGs-NSps; &p < .01 with PEG-ACGs-NSps; #p < .01, ##p < .001 with normal saline. (C) The growth of relative tumor volume over time of PTX injections, PEG-ACGs-NSps, and FA-PEG-ACGs-NSps. (D) The average body weight change of mice along with time. All data are represented as mean ± SD. *p < 0.01, **p < 0.001 with FA-PEG-ACGs-NSps; &p < 0.01 with PEG-ACGs-NSps; #p < 0.01, ##p < 0.001with normal saline.
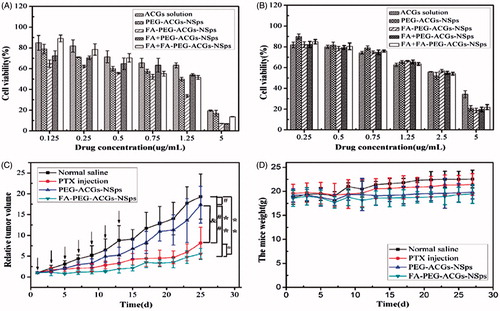
Table 1. IC50 values of ACGs solution, PEG-ACGs-NSps, FA-PEG-ACGs-NSps, FA + PEG-ACGs-NSps, and FA + FA-PEG-ACGs-NSps against HeLa and A549 cell lines after incubation for 24 h.
Table 2. In vivo antitumor effects of different groups against HeLa tumors in mice.
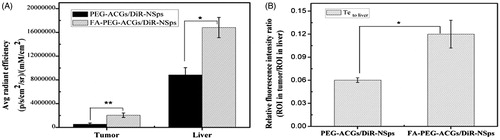
Figure 4. The in vivo biodistribution of PEG-ACGs/DiR-NSps, and FA-PEG-ACGs/DiR – NSps in HeLa tumor-bearing mice. (A) Average fluorescence intensity in tumors of two groups at the end of the experiment. (B) The ratio of the fluorescence intensity in tumor to the fluorescence intensity in liver (Te to liver) of two groups at the end of the experiment. All data are represented as mean ± SD. *p < .05, **p < .01 with FA-ACGs-NSps.