Figures & data
Figure 1. Characterization of PUE@PEG-PE micelles. (A) Transparent reddish solution and Tyndall phenomenon. (B) TEM photographs. (C) Size distribution. (D) Zeta potential distribution.
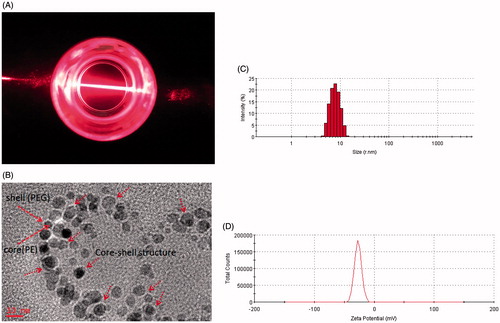
Figure 2. Core–shell structure of PUE@PEG-PE micelles. (A) The 1H NMR spectrum of (a) PUE, (b) blank PEG-PE micelle in D2O, (c) PUE@PEG-PE micelle in D2O, and (d) PUE@PEG-PE micelles in DMSO. (B) FT-IR analysis of (e) PUE, (f) blank PEG-PE micelles, and (g) PUE@PEG-PE micelles.
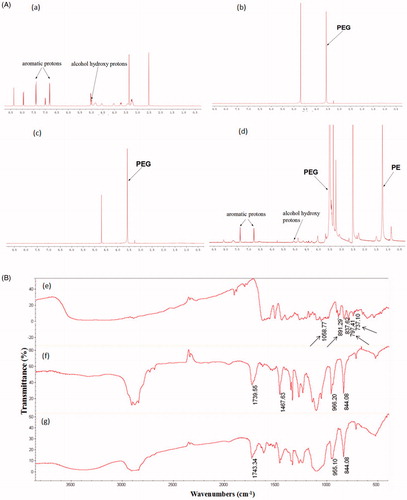
Figure 3. In vitro study of PUE@PEG-PE micelles. (A): Release curve of PUE and PUE@PEG-PE micelles. (B): Hemolysis percentages of PUE and PUE@PEG-PE micelles at PUE concentrations ranging from 12.5 to 1600 μg/mL, which were incubated with human red blood cells (RBCs) at 37 °C for 2 h (n = 3).
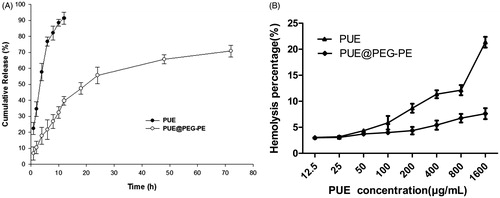
Figure 4. Blood concentration–time profiles in rats after intravenous administration of PUE and PUE@PEG-PE micelles (n = 5).
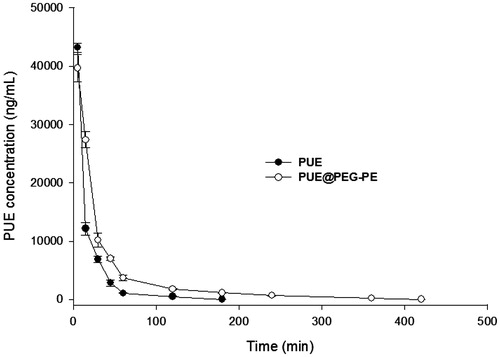
Figure 5. Protective effect of PUE@PEG-PE against ISO-induced H9c2 cells apoptosis. (A, B) Hoechst 33258 staining; (C) Caspase 3 activity; (D) Apoptosis-related protein (Bcl-2 and Bax) expression. Date are mean ± SEM (n = 3). (*p < .05, **p < .01).
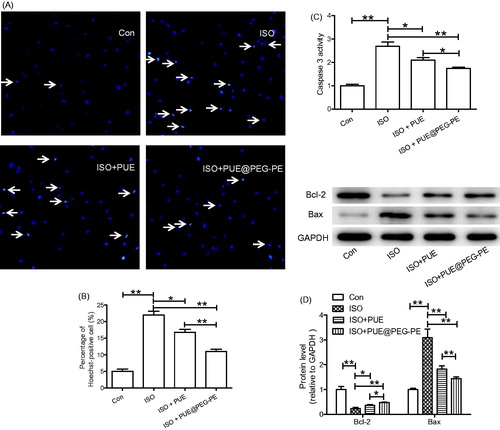
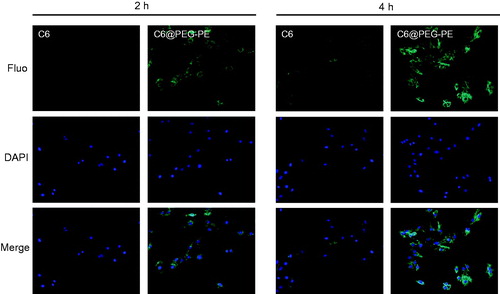
Figure 6. Cellular uptake of C6 and C6@PEG-PE micelles incubation in H9c2 cells at different time. Green shows C6 or C6@PEG-PE micelles, Blue indicates the cell nucleus.