Figures & data
Figure 1. 1H NMR spectra of estrone (A) and DSPE-PEG2000-ES (B), and FT-IR spectra of DSPE-PEG2000-COOH and DSPE-PEG2000-ES (C).
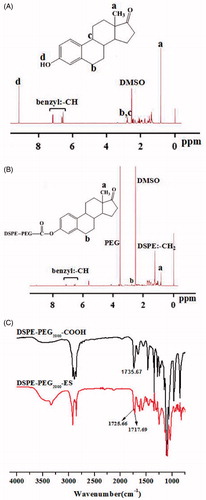
Table 1. The size, polydispersity index (PDI), zeta potential, drug-loading content (DL) and encapsulation efficiency (EE) of different liposomes.
Figure 2. TEM images of Chol-COS/ES-Lp (A) and Chol-SS-COS/ES-Lp (B), and their drug release profiles in PBS (10 mM, pH 7.4) containing GSH at various concentrations (0, 20 μM or 10 mM) (C).
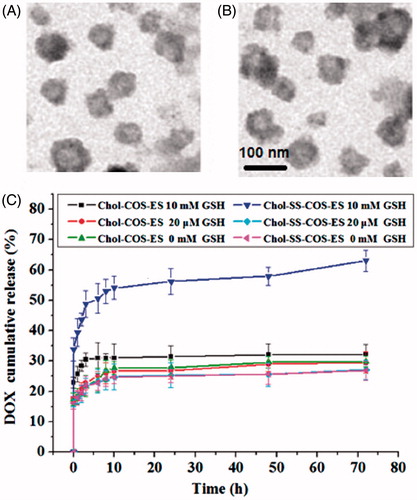
Figure 3. Flow cytometry analysis of LO2 (A) and MG63 cells (B) incubated with free DOX and three different formulations for 1, 2, 3 and 4 h. DOX dosage was 20 μg/ml. Data represent the mean ± SD (n = 3). *p < .05; **p < .01 and ***p < .001.
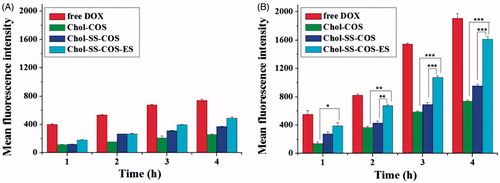
Figure 4. Confocal microscopy images of (A) MG63 cells and (B) LO2 cells. Cells were treated with free DOX solution (a), Chol-COS/DOX-Lp (b), Chol-SS-COS/DOX-Lp (c) and Chol-SS- COS/ES/DOX-Lp (d) for 2 h and 4 h, respectively.
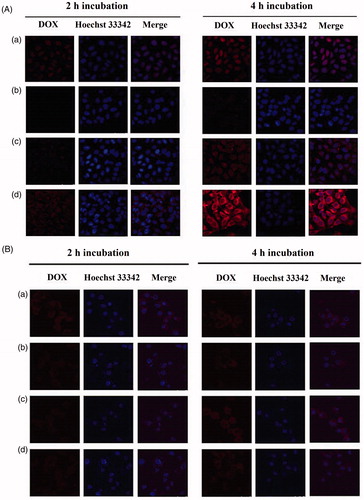
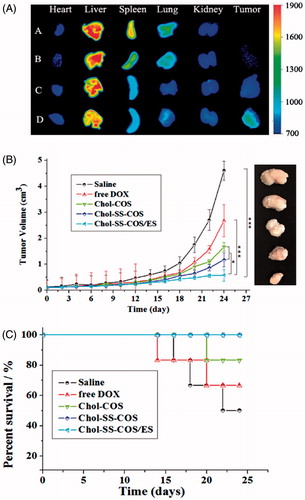
Figure 5. (A): Ex vivo imaging of tumors and major organs of MG63 tumor-bearing nude mice at 4-h postinjection of A: free DiR, B: Chol-COS/DiR-Lp. C: Chol-SS-COS/DiR-Lp; D: Chol-SS-COS/ES/DiR-Lp at DiR dose of 500 μg/ml, 0.2 ml. (B) The antitumor effects of different DOX formulations at in MG63 tumor bearing nude mice (mean ± SD, n = 5 initially); and (C) Animal survival rates. *p < .05, **p < .01, ***p < .001. The drug dosing at 5 mg/kg of DOX per injection started on Day 0 and repeated on Days 4, 8 and 12.