Figures & data
Figure 1. Fluorescence intensities (RFU) of HeLa cells after incubation with 10 µM FAM-labeled CPPs. The peptides are sorted by signal intensities, with bars indicating the mean of two measurements. The inset shows examples of the performance of one CPP candidate each of high, medium and low uptake efficiency (fluorescence images of the cell layers with histograms detailing the respective brightness of untreated 12-bit images). Bar: 200 µm.
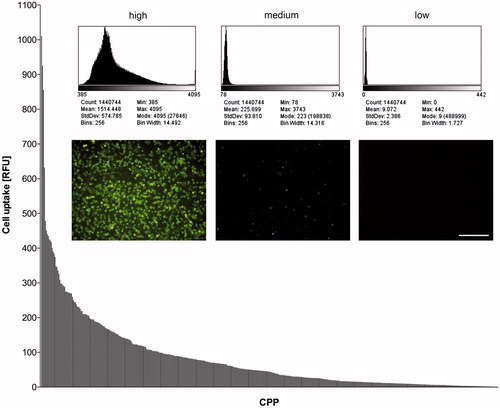
Table 1. Characteristics and uptake performance of the top 20 CPPs in our setup.
Figure 2. Uptake efficiency (RFU) of FAM-CPPs into HeLa cells (see Figure 1) in relation to the final peptide concentration measured at the isosbestic point. The final peptide concentration is represented by the optical density (OD) at a wavelength of 460 nm after dilution of the stock solutions with PBS.
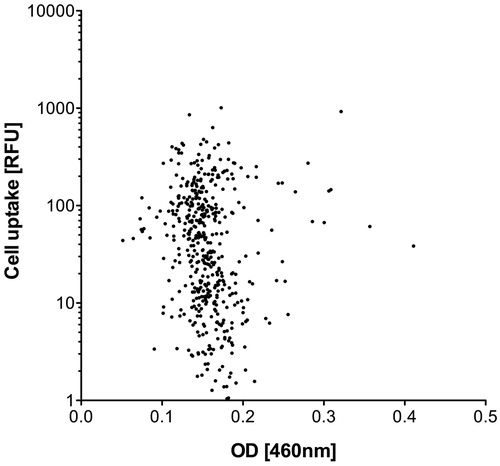
Figure 3. Fluorescence intensities (RFU) of HeLa cells after incubation with 10 µM FAM-labeled CPPs. The peptides are sorted by sequence length, in the same order as listed in Supplementary Table TS1. Bars indicate mean value and standard error of two measurements, dotted lines under the diagrams delineate ranges of the different peptide lengths (4–24 amino acids).
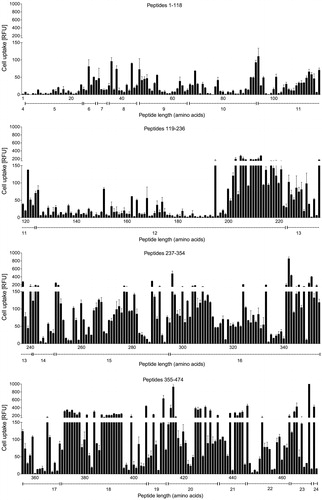
Figure 4. Cell uptake of the CPPs (expressed in fluorescence intensities (RFU)) compared with respect to sequence length (A), net charge (B), and hydropathy score (C). Horizontal lines indicate the mean value of each group. Differences between groups were assessed for statistical significance by the Kruskal–Wallis test: ***p < .001; ns: not significant.
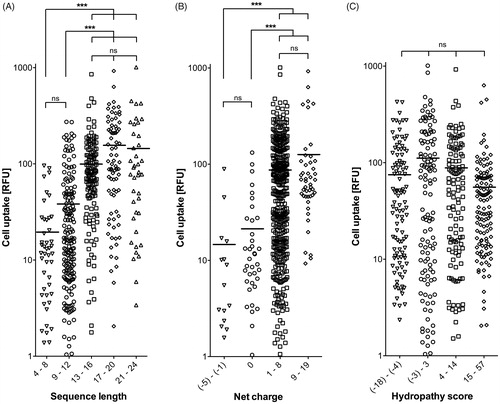
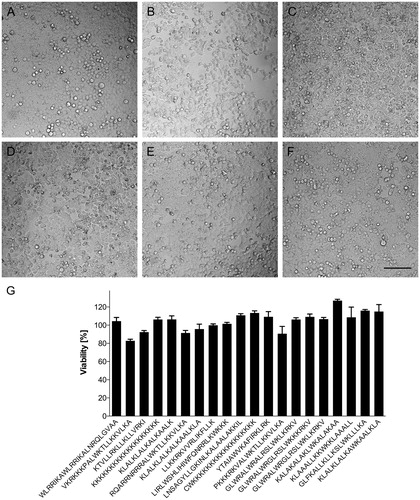
Figure 5. Viability of HeLa cells after incubation with 10 µM of FAM-labeled CPPs for 90 min at 37 °C. (A–F) En face microscopic analysis of cell layers after incubation with: (A) medium only; (B) WLRRIKAWLRRIKALNRQLGVAA; (C) VKRKKKPALWKTLLKKVLKA; (D) KTVLLRKLLKLLVRKI; (E) KKKKKKKKKKKKKKKKKKK; and (F) KLALKLALKALKKAALK. Dark shadows are caused by proximity to well walls. Bar 100 µm. (G) Cell viability, analyzed by MTT-test, after incubation with top 20 CPP in our setup (see ; 1–20 from left to right). Bars indicate mean values and standard deviations of quadruplicate measurements. HeLa cells incubated in cell growth medium without CPP were defined as 100% viable.