Figures & data
Figure 1. Transmission scanning electron micrographs of CsA loaded mPEG-PLA micelles before lyophilization (A), after reconstitution (D) and after 3 months storage at 4 °C (E); (B) size distribution of CsA-loaded mPEG-PLA micelles; (C) zeta potential of CsA-loaded mPEG-PLA micelles; (F) lyophilized product appearance of six excipients.
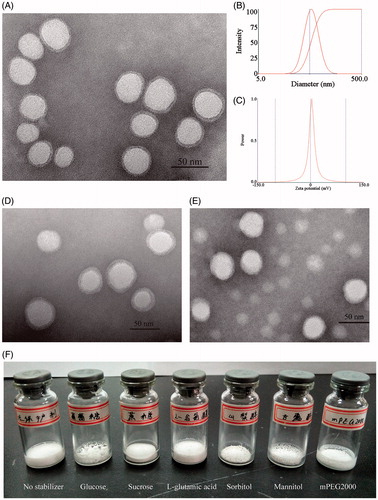
Figure 2. (A) Particle size (S2/S1) ratio of the CsA-loaded polymeric micelles composed of various concentration of mPEG2000. (B) Percent CsA remaining of polymeric micelles comprising various concentration of mPEG2000 after 3 months storage at 4 °C. (C) and (D) The measured parameters of the CsA-loaded polymeric micelles after 3 months storage at 4 °C compared with the initial time. H3/H0 is the ratio of height of lyophilized cake; S3/S0 is the ratio of particle size of polymeric micelles; PI3/PI0 is the ratio of polydispersity index of polymeric micelles; ZP is the Zate potential, the subscript numbers 0 and 3 denote 0 and 3 months after storage, respectively. Mean ± SD, n = 3. **Statistically significant difference between the compared formulations (p < .01). ***Statistically significant difference between the compared formulations (p < .001).
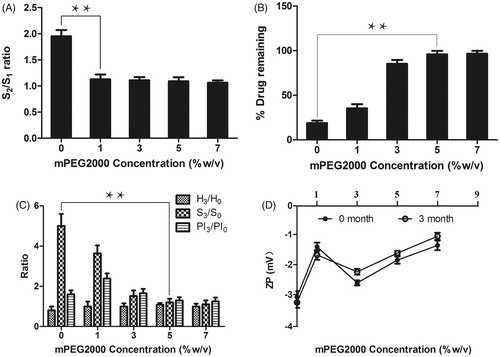
Figure 3. (A) Rheology profiles of different formulations; (B) in vitro release profile of CsA emulsion and CsA loaded mPEG-PLA micelles in 0.25% SLS solution. Mean ± SD, n = 3.
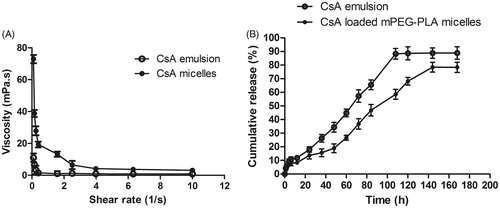
Figure 4. The cytotoxicity study on free CsA and CsA emulsion and CsA-loaded mPEG-PLA micelles. (A) and (B) represent the cytotoxicity of free CsA and CsA emulsion, CsA-loaded micelles and blank micelles against HCE-2 cells at 24 h and 48 h, respectively. n = 6, mean ± SD. *, **, and *** represents p < .05, p < .01 and p < .001, respectively.
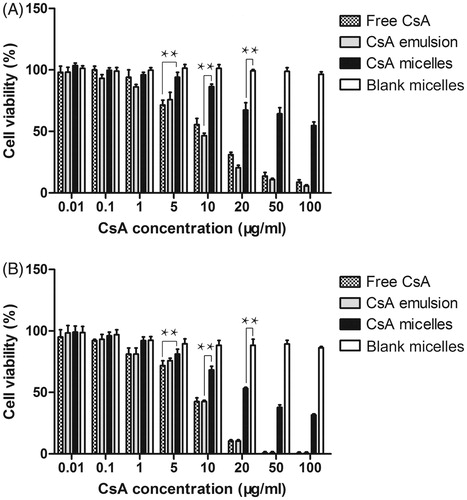
Figure 5. Cellular uptake of nile red by HCE-2 cells. (A) Photographs of representative series of cells exposed to 1 μl/ml nile red reference solution and mPEG-PLA micelles for 1 h and 4 h, respectively. (B) These histograms showed the cellular uptake efficiency (%) of different inhibitors on HCE-2 cells (n = 3, mean ± SD). * and ** indicated p < .05 and p < .01 versus control group.
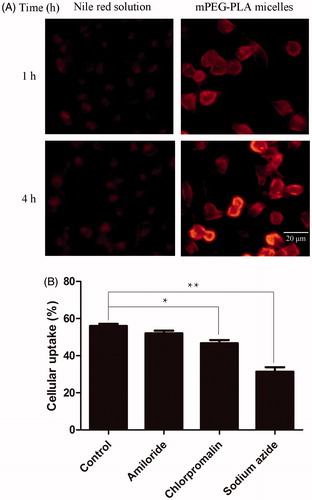
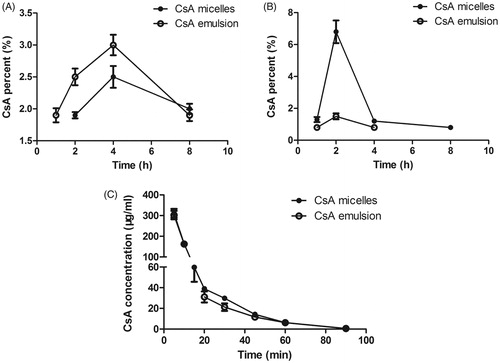
Figure 6. CsA percent-time profiles of CsA after instillation of CsA micelles and CsA emusion in the (A) aqueous humor and (B) corneal (n = 3, mean ± SD). (C) Concentration of CsA in rabbit tear fluid as a function of time after instillation of the CsA loaded mPEG-PLA micelles and 5% CsA emulsion (n = 6, mean ± SD).