Figures & data
Figure 1. Selection of Pluronic®, combined with the PEI-based polyplexes, for the production of micelles. (A) Poly(ethylene glycol) (PEG), polypropylene oxide units (PPO) and critical micelle concentration (CMC) values of the different Pluronic® used (according to the manufacturer) and the physicochemical characterization (size, polydispersity, surface charge) of the resulting Pluronic®-based micelles. Results are expressed as mean ± SD, n = 3. (B) Differences on the intensity of GFP in GFP expressing RXO-C cells upon incubation with PEI-siRNA polyplexes and PEI-siRNA-Pluronic® micelles (obtained by direct dissolution method). Silencing efficacy reached by Lipofectamin® 2000 was used as gold standard for normalization of the results. Results are expressed as mean ± sd (n ≥ 3). *p ≤ .05 compared to the polyplexes without Pluronic® F127. (C) Fluorescent microscopy photographs confirming the GFP silencing efficacy of the selected formulation for siGFP delivery. No gene inhibition was observed in cells transfected with siControl sequence (siC).
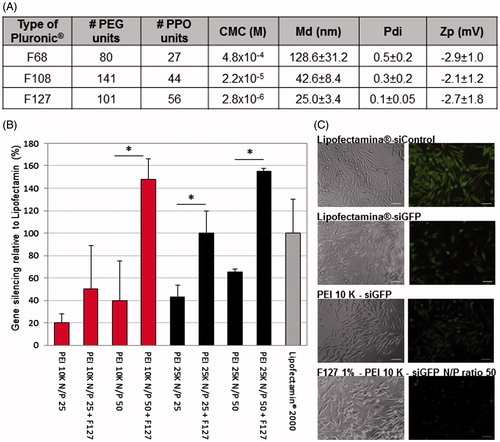
Figure 2. Physicochemical characterization of F127 PM for siRNA delivery. (A) Summary of size, polydispersity, zeta potential and osmolarity values of PM. Results are expressed as mean ± sd (n ≥ 3). (B) mean hydrodynamic diameter distribution of PM-siControl represented trough the graph of size dispersion by intensity together with TEM images of PM at different magnifications. Scale bar represents 100 nm and 50 nm, respectively. (C) siRNA entrapment efficient determined by a spectrophotometer method. Results are expressed as mean ± sd (n ≥ 3). (D) siRNA entrapment efficient determined by agarose gel retardation assay.
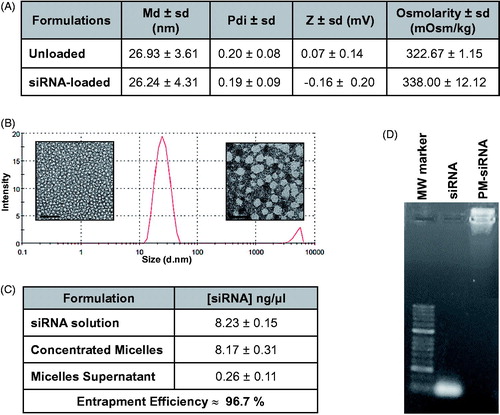
Figure 3. Internalization profile of PM. (A,B) FACS quantification of micelles uptake by MDA-MB-231 and MCF-7 ALDH1A1 tdTomato positive vs. negative cells. The cells were incubated with the 5-DTAF labeled PM and the percentage of cells emitting green fluorescence (A) as well as the intensity of fluorescence (B) was quantified at different time-points. Results are expressed as mean ± sd (n = 3), **p ≤ .01 for de comparison between CSC and non-CSC. (C) Confocal Microscopy analysis of particles internalization containing a fluorescent siRNA (siRNA-AlexaFluor 488). The arrow illustrates the respective intracellular distribution of nanoparticle and Lysotracker DND-99. Note: For better comprehension of the image please visualize the online version of the manuscript.
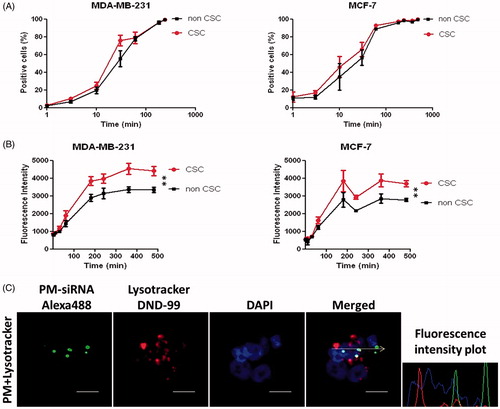
Figure 4. In vitro and in vivo toxicity of PM. (A) Assessment of the effects of PM and isolated components concentration in vitro. IC50 values for each component and for PM. The values were obtained by interpolation of y = 50 from the dose-effect curves fit using the real concentrations used for each sample. Results are expressed as mean ± sd (n = 3). (B) In vivo the PM did not show any toxicity. In the graph is presented the body weigh variation of animals up to 12 days postadministration of the samples. Results are expressed as mean ± sd (n = 3).
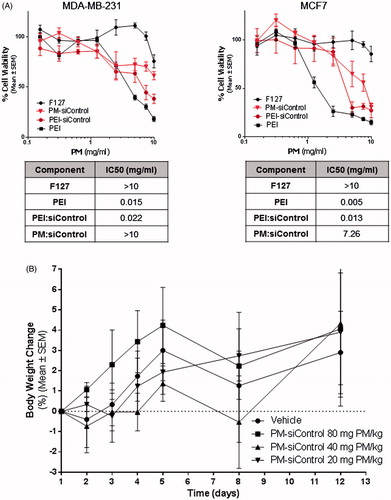
Figure 5. GFP reporter assay for PM biological efficacy assessment. (A) Fluorescent images of MDA-MB-231/GFP cells were taken 24, 48 and 72 h after incubation with PM-siGFP and PM-siControl. (B) Time-lapse experiment in which fluorescent images was captured each 30 min during the 72 h period of incubation of the same cells with siGFP and siControl associated with PM or Lipofectamine® 2000. The values represent the fluorescent intensity detected for each time-point. Results are expressed as mean ± sd (n = 3), ***p ≤ .001 for the comparison between PM-siGFP and Lipofectamine-siGFP. Lipofectamine® 2000 is represented as Lipo.
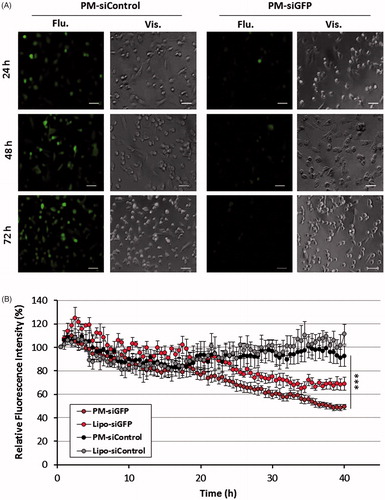
Figure 6. PM-siAKT2 effects in MDA-MB-231 and MCF-7 CSC. (A): The reduction of AKT2 gene expression was detected in both cell lines through qPCR. The presented values are normalized to the housekeeping genes (Actin and GADPH). (B) Quantification of the number of invasive cells after incubation with PM-siAKT2 vs. PM-siC. (C) Quantification of the number of transformed cells after incubation with PM-siAKT2 vs. PM-siC. Colonies formation on the soft agar after incubation of cells with PM-siAKT2 vs. PM-siC. Results are expressed as mean ± sd (n = 3), ***p ≤ .001 for the comparison between PM-siC and PM-siAKT2. siControl is represented as siC.
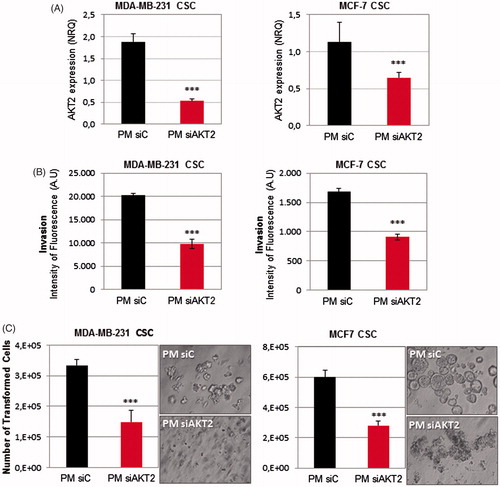
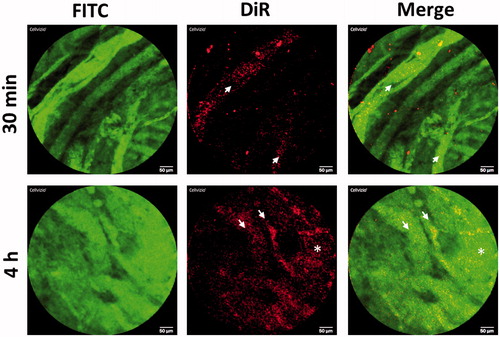
Figure 7. In vivo behavior of PM-siAKT2 in tumors. Real time fibered confocal fluorescence microscopic (FCFM) images of mice administered with DiR labeled PM. Images correspond to representative single frame of live FCFM imaging of tumors of mice administered 30 min prior to imaging (half the dose of DiR-PM) and 4 h before imaging (full dose of DiR-PM). Vasculature was visualized using FITC-Dextran (500 mg/kg). Signal corresponding to DiR-labeled PM is mainly localized into the vessels 30-min post-administration (see arrows), while the DiR signal is more dispersed and distributed 4-h post-administration (asterisk), clearly showing that the PM extravasated from the vessels invading the tumoral parenchyma. Note: For better comprehension of the image please visualize the online version of the manuscript.