Figures & data
Figure 1. The structures and the cytotoxicity of the two new compounds. (A–B) The structures of the two new compounds (A) and S2101 (B). (C) The cytotoxicity of the two new compounds. Confocal images of the apical, middle, and basal turns in the cochlear explant cultures with only compound A (b–f) or B (h–l) for 4 h, 12 h, or 24 h. Normal tissues with no compound were used as controls (a, g). No cytotoxicity to the in vitro cochlear explants was observed at 20 μM compound A (b–d) or B (h–l) from 4 h to 24 h. At 40 μM compound A (e) and B (k) for 24 h, the cochlear explants showed no obvious change in morphology or the number of HCs. When treating the cochlear explants with 200 μM compound A for 24 h, the number of HCs decreased from the apical to basal turn, the HCs exhibited altered morphologies, and numerous TUNEL-positive cells were seen (f). There were no obvious changes in the morphology or arrangement of HCs when treating the cochlear explants with 200 μM compound B for 24 h (l). The HCs were labeled with myosin VIIa antibody (green), and the nuclei were stained with DAPI (blue). Apoptotic cells were labeled with TUNEL (red). (D) The quantification of HCs treated with different concentrations of the compounds at different time points. The HC numbers in the three different turns of the cochlear cultures treated with 20 μM compound A (a) or compound B (b) for 4 h, 10 h, or 24 h are shown in the bar charts. HC numbers in the cochlear cultures treated with 20 μM, 40 μM, and 200 μM compound A (c) and B (d) for 24 h are shown in the bar charts. Four cochleae were used for each group. Data are expressed as the mean ± S.E. ***p < .01 vs. the 20 μM compound A group by one-way ANOVA.
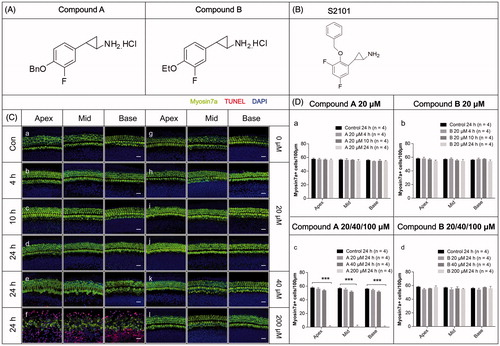
Figure 2. The synthesis of the new compounds (using compound A as an example).
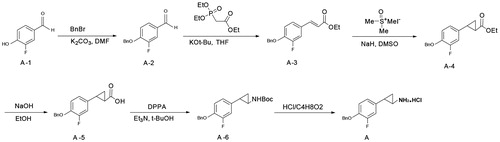
Figure 3. Assessment of HC survival upon gentamycin treatment with or without compound A or B. (A) The schematic diagram of the experiment. (B) Confocal images of the apical, middle, and basal turns in the control (untreated, a1–c1) and gentamycin only (a2–c2) cochlear explant cultures and the compound A (a3–c3), compound B (a4–c4), and S2101 (a5–c5) pretreated cultures. The HCs were labeled with myosin VIIa antibody (green), and the nuclei were stained with DAPI (blue). Scale bar =25 μm. (C) HC counts in the apical, middle, and basal turns of the cochleae from untreated controls, gentamycin-only controls, and pretreatment with compounds A, B, and S2101. Twelve cochleae were used for each group. Data are expressed as the mean ± S.E. * p < .05 vs. the gentamycin-only group by One-Way ANOVA.
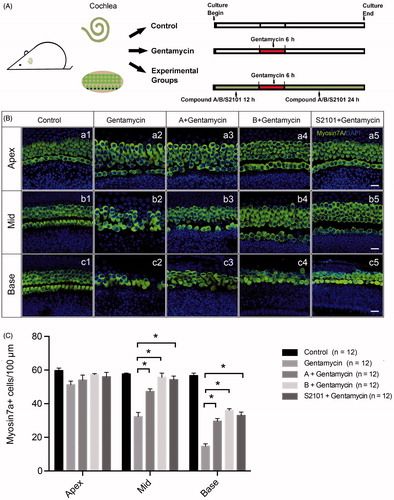
Figure 4. Compounds A and B maintain the level of H3K4me2 in the presence of gentamycin. (A) The schematic diagram of the experiment. (B) The changes in global H3K4 dimethylation (H3K4me2) levels in response to gentamycin exposure and treatment with the different compounds. The normal levels of H3K4me2 are represented by immunofluorescent staining in untreated HCs (a). The H3K4me2 level decreased compared to the control group at 2 h (b), 4 h (c), and 6 h (d) after exposure to 1 mM gentamycin. After 6 h gentamycin exposure, the relative fluorescence intensity of H3K4me2 was significantly stronger in the cultures pretreated with compound A or B (e, f) compared with the gentamycin-only controls (d). Images were taken from the middle turn. The green spots represent the H3K4me2 signal, the anti-myosin VIIa antibody (red) shows the HCs, and the nuclei are stained with DAPI (blue). Scale bar =25 μm. (C) The semi-quantification of the immunofluorescence of H3K4me2 in the different groups (a). The quantification of HCs in the cochlear explants of the different groups (b). Six cochleae were used for each group. Data are expressed as the mean ± S.E. *p < .05, gentamycin-only group vs. the control group by one-way ANOVA. * p < .05, compound treatment groups vs. the gentamycin-only 6 h group by one-way ANOVA. (D) Western blot analysis of H3K4me2 levels in the normal group and the gentamycin-exposed cochlear explants with or without pretreatment with compound A or B. GAPDH was used as the loading control. The mean ± S.E. is shown for three experimental replicates. *p < .05 vs. the gentamycin 6 h group by one-way ANOVA.
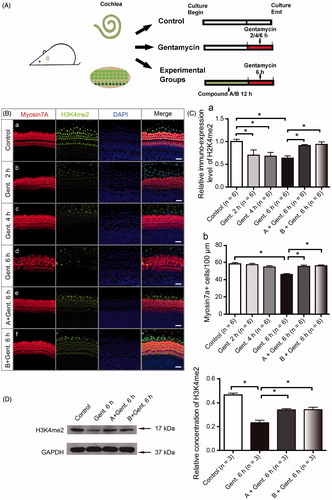
Figure 5. The new compounds reduce apoptosis in the organ of Corti after gentamycin exposure. (A) The schematic diagram of the experiment. (B) The level of cleaved caspase-3 in the organ of Corti decreased in the presence of compound A (c) and compound B (d) when compared with the gentamycin-only group (b). The normal group with no treatment was used as controls (a). (C) The quantification of HCs (a) and myosin VIIa/cleaved caspase-3 double-positive cells (b) in the different groups. Confocal images were taken from the middle turn of each group. The red spots represent the cleaved caspase-3 signal, and anti-myosin VIIa antibody (green) is used as the HC marker. Scale bar =25 μm. Six cochleae were used for each group. Data are expressed as the mean ± S.E. *p < .05 vs. the gentamycin-only group by one-way ANOVA. (D) The relative level of cleaved caspase-3 was measured by Western blot analysis. GAPDH was used as the loading control. All data are shown as the mean ± S.E. for three experimental replicates. *p < .05 vs. the gentamycin-only group by one-way ANOVA. (E) The TUNEL-labeled cells in the organ of Corti decreased in the presence of compound A (c) and compound B (d) when compared with the gentamycin-only controls (b). The normal group with no treatment was used as the control (a). The red spots represent the TUNEL signal. Confocal images were taken from the middle turn of each group. Scale bar =25 μm. (F) The quantification of HCs (a) and myosin VIIa,/TUNEL double-positive cells (b) in the different groups. Six cochleae were used for each group. Data are expressed as the mean ± S.E. *p < .05 vs. the gentamycin-only group by one-way ANOVA.
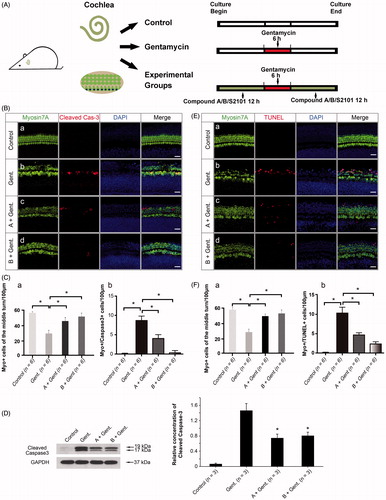
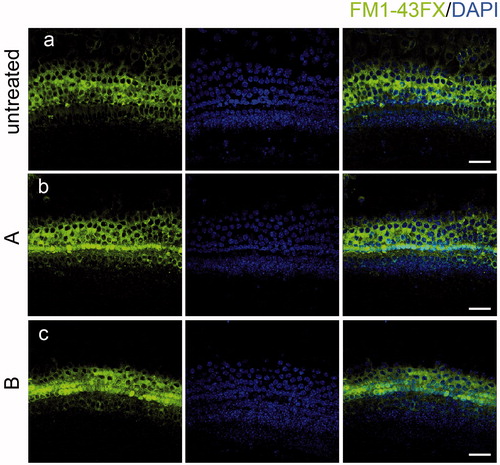
Figure 6. The new compounds do not interfere with FM1-43FX uptake. Compound A and B did not change the uptake of FM1-43FX in the organ of Corti (b, c) compared with the untreated group (a) indicating that HC functions were not affected by exposure to the new compounds. Confocal images were taken from the middle turn of each group. The green fluorescence represents the FM1-43FX signal. Scale bar =20 μm.