Figures & data
Figure 1. Intended drug delivery paradigm: (A) BBB is locally opened (indicated by dashed vessel walls) in the region where hyperthermia is applied. (B) Drug (triangles) is released from TSL (circles) in region where BBB is opened, facilitating localized drug delivery across the BBB.
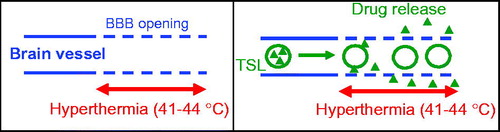
Table 1. Time averaged temperature over hyperthermia duration (15 or 30 min), shown for both nonsurvival studies (four hyperthermia treatments per dog) and survival study (one hyperthermia treatment per dog).
Figure 2. The four locations where hyperthermia was applied are indicated by fiducial markers (white arrows) in this X-ray image. The hyperthermia probe was placed through burr holes, penetrating ∼10–15 mm deep into brain tissue.
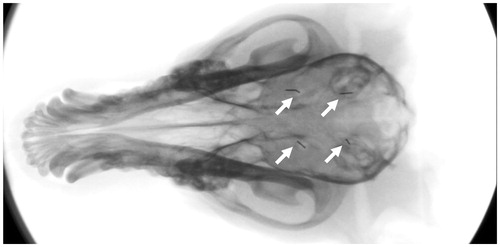
Figure 3. TSL release kinetics. (A) Doxorubicin is almost completely released within ∼2 s when TSL are heated to above 41 °C. (B) TSL stability at body temperature: Approximately 35% of drug is released at 37 °C within the first 5 min, but remaining drug remains stable within TSL.
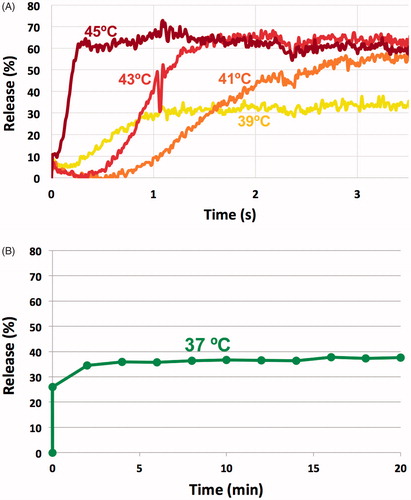
Figure 4. Hyperthermia probe temperature maps measured in vitro in gel phantoms. (A) Temperature maps after 3 min heating are plotted at 45 (left) and 50 °C (right) [probe tip at bottom; in animal studies, only the distal 15 mm was inserted into tissue (arrows)]. (B) Radial temperature profile ∼7 mm from the probe tip for 45 and 50 °C. Temperatures exceeding 41 °C (i.e. where doxorubicin release from TSL is expected) extend ∼4 and ∼6 mm from the probe for 45 and 50 °C, respectively. In vivo, these distances are likely somewhat reduced since blood perfusion-mediated cooling limits temperature spread into tissue.
![Figure 4. Hyperthermia probe temperature maps measured in vitro in gel phantoms. (A) Temperature maps after 3 min heating are plotted at 45 (left) and 50 °C (right) [probe tip at bottom; in animal studies, only the distal 15 mm was inserted into tissue (arrows)]. (B) Radial temperature profile ∼7 mm from the probe tip for 45 and 50 °C. Temperatures exceeding 41 °C (i.e. where doxorubicin release from TSL is expected) extend ∼4 and ∼6 mm from the probe for 45 and 50 °C, respectively. In vivo, these distances are likely somewhat reduced since blood perfusion-mediated cooling limits temperature spread into tissue.](/cms/asset/02087158-6dac-4ab2-9c12-1c5c49284cbf/idrd_a_1461280_f0004_c.jpg)
Figure 5. (A) Plasma PK for four animals in the nonsurvival study. Dog 3 had slightly higher body temperature (∼38 °C) during anesthesia than intended, explaining the considerably lower plasma drug concentration that likely resulted from premature systemic drug leakage from the TSL. (B) Plasma PK for five animals in the survival study, where only two plasma samples following drug infusion were obtained in each animal.
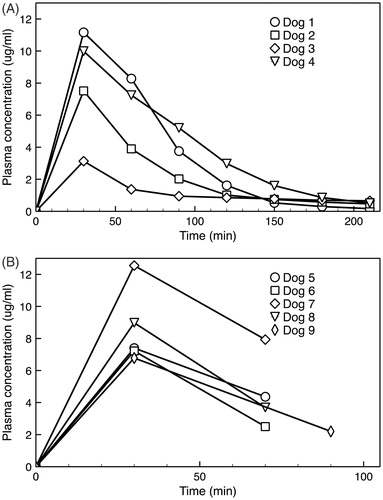
Figure 6. Tissue doxorubicin concentration separated by hyperthermia condition. There was a trend toward larger drug concentration at both higher temperatures and longer durations, but these did not reach statistical significance.
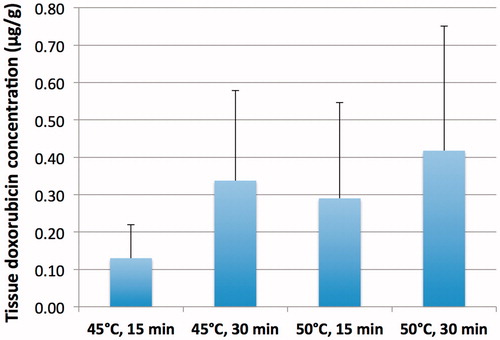
Table 2. Tissue doxorubicin concentrations of tissue exposed to hyperthermia.
Figure 7. Fluorescence microscopy demonstrates localized doxorubicin delivery to tissue regions surrounding the hyperthermia probe (50 °C, 30 min).
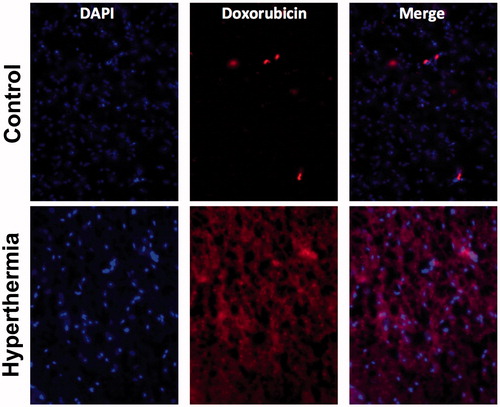
Table 3. Average tissue concentration from regression analysis.
Table 4. Linear mixed effects regression results.
Figure 8. Plasma concentration area under the curve (AUC) predicts tissue drug uptake. (A) AUC was calculated based on plasma concentration measured in each particular animal, during the time when hyperthermia was applied. The four shaded regions represent the plasma AUC’s corresponding to the four hyperthermia applications in dog 1 (15, 30, 15, and 30 min, respectively; this sequence varied among animals per ). (B) Plasma AUC calculated during hyperthermia correlates with tissue drug concentration. Each marker represents a tissue sample where drug concentration was measured, plotted against plasma AUC calculated when hyperthermia was applied for that particular sample and animal. Marker color indicates hyperthermia temperature of 45 °C (blue) or 50 °C (red); marker shape represents duration of 15 min (triangles) or 30 min (squares). Dashed lines represent linear fits for each of the two temperature data sets as used in the statistical model B. Plasma AUC was a statistically significant predictor (p = .003) of tissue drug concentration, and temperature trended toward statistical significance (p = .07).
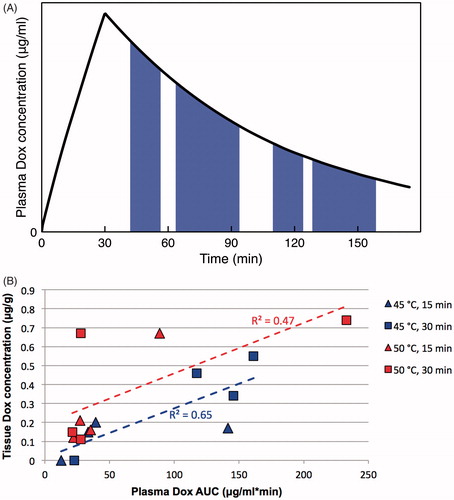
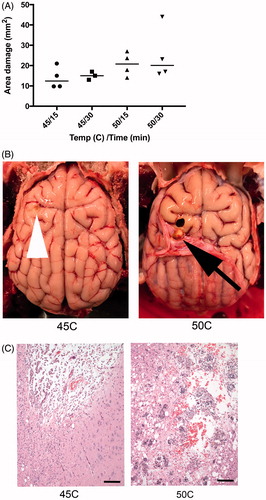
Figure 9. (A) Higher temperature and longer hyperthermia duration resulted in increased area of cerebral damage, measured from gross sectioned tissue in acute animals. (B) There is a defect in both brains, but to a lesser extent in animal exposed to 45 °C (tip of white arrow head). In animals exposed to 50 °C, there is a gross cavity within cerebral parenchyma and an associated expansion of the dura mater (black arrow). (C) Histology damage assessment. Both images are at 100× magnification and represent the ventral aspect of the probe insertion site. There is less damage to the surrounding parenchyma in the dog exposed to 45 °C (left) compared to 50 °C (right). Animals exposed to 50 °C had increased hemorrhage, vacuolization (clear spaces), and inflammatory response. Scale bar is 100 μm.