Figures & data
Figure 1. CEQ-loaded PLA microspheres observed by scanning electron microscopy.
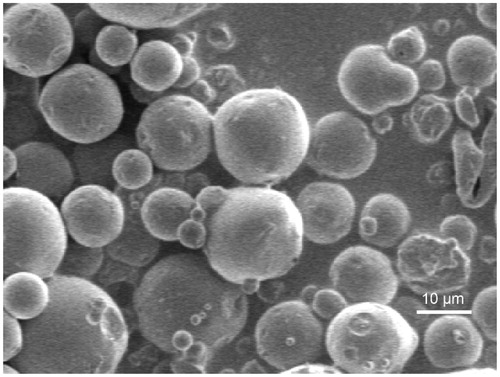
Figure 2. Cumulative CEQ release from CEQ -PLA-microspheres in PBS (pH 7.4). In vitro release kinetics were obtained at 37 ± 1 °C by dialysis. CEQ release from the drug stock solution was used as control. CEQ loading was 18.7 ± 1.2%. Data are presented as mean ± SD, n = 3.
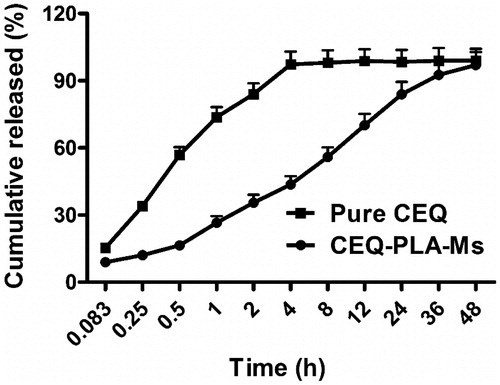
Figure 3. The absorbance at a wavelength of 550 nm represented phagocytosis by macrophages. Data are means ± SD, n = 6. a–dMeans at that time period for phagocytosis were statistically different (p < .05).
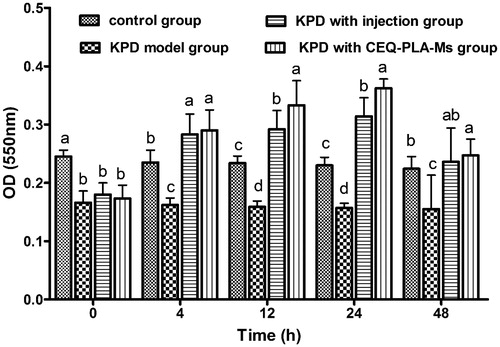
Figure 4. Klebsiella pneumonia bacterial counts in lung following i.v. administration of a single 12.5 mg/kg dose of CEQ-loaded microspheres or CEQ injection. Each point represents the mean ± SD, n = 6. *p < .05 compared with KPD model group. #p < .05 compared with CEQ injection group.
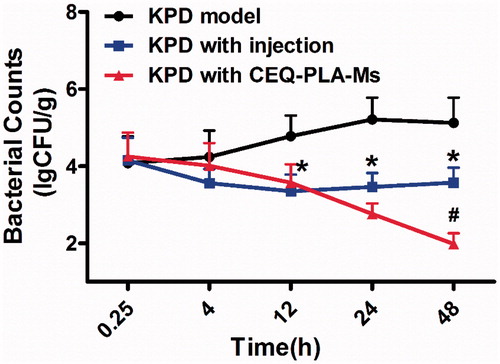
Figure 5. Cytokines in bronchoalveolar lavage fluid. The columns represent the levels of TNF-α (A), IL-1β (B), IL-8 (C), IL-4 (D), IL-10 (E) and IL-13 (F) in four groups of rats: control (no infection or drug), KPD model (infected, no drug), KPD with CEQ injection and KPD with CEQ-loaded PLA-microspheres. Results are given as mean ± SD, n = 6. *p < .05, KPD with injection versus KPD model. #p < .05, KPD with CEQ-PLA-Ms versus KPD with injection.
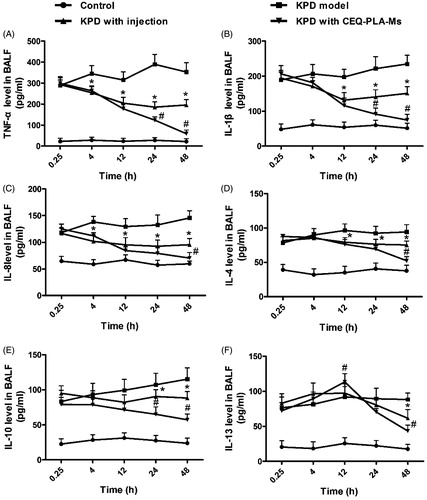
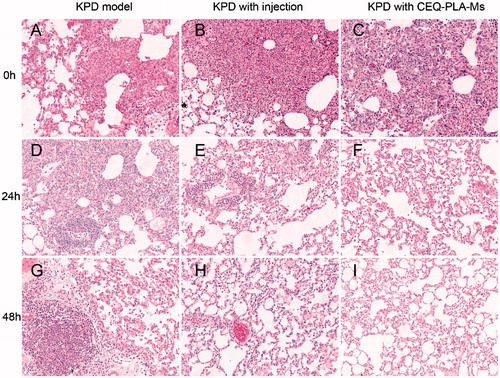
Figure 6. H and E staining of lung tissues from rats after experimental treatments KPD model (infected, no drug) (A, D, and G); KPD model treated with CEQ only injection (B, E and H); KPD model treated with CEQ-PLA-microspheres (C, F and I). Haematoxylin–eosin. Magnification 20×.