Figures & data
Figure 1. (a) Amino acid sequence of l-TCTP-PTD 13 and its analogs. Amino acid modifications in l-TCTP-PTD 13 are underlined. (b) Cellular uptake of FITC-labeled peptides in BEAS-2B cells analyzed by a flow cytometer. (c) Histograms of l-TCTP-PTD 13, l-TCTP-PTD 13M1, and l-TCTP-PTD 13M2. Each bar represents the standard deviation of three independent replicates. The mean fluorescence intensity of FITC-labeled l-TCTP-PTD 13 in BEAS-2B cells was set to 100%. *p < .05 versus FITC-labeled l-TCTP-PTD 13.
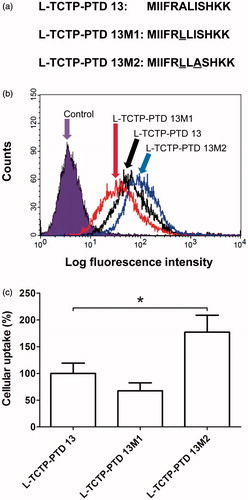
Figure 2. (a and b) Plasma insulin concentration in normal rats following intranasal administration of insulin in the presence of 0.1 mM (a) or 0.25 mM (b) TCTP-PTD analogs containing l-amino acids. (c) Plasma insulin concentration following intranasal administration of insulin with 0.25 mM d-TCTP-PTD analogs. Insulin doses were 5 and 1 IU/kg for insulin alone and insulin plus PTD, respectively. Vertical bars indicate means ± SEM (n = 5–7). (d) LDH leakage in nasal fluid of normal rats following intranasal administration of insulin (1 IU/kg) with different PTDs. Sodium taurodeoxycholate (5% w/v) served as a positive control. Each bar represents mean ± SEM (n = 6). *p < .01 versus insulin alone.
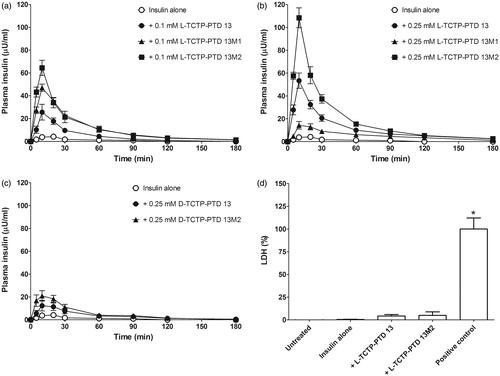
Table 1. Pharmacokinetic parameters following intranasal administration of insulin plus TCTP-PTD analogs in normal rats.
Figure 3. Changes in blood glucose levels in rats with alloxan-induced diabetes following intranasal administration of insulin plus l-TCTP-PTD analogs. Insulin doses were 2 and 1 IU/kg for administration by the nasal route and s.c. injection, respectively. Vertical bars indicate means ± SEM (n = 6–8).
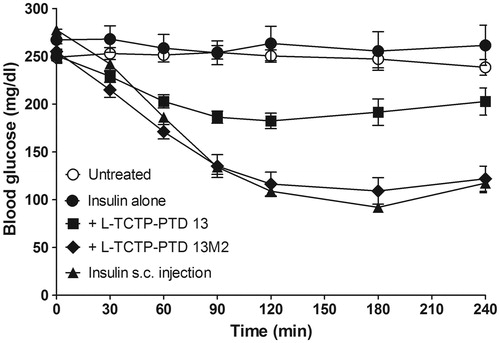
Table 2. Pharmacodynamics of insulin in rats with alloxan-induced diabetes.
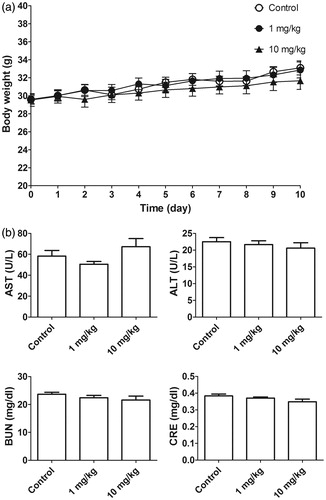
Figure 4. (a) Body weight of normal mice (n = 6) after daily intraperitoneal injection of l-TCTPPTD 13M2 for 10 days. (b) Biochemical analysis of AST, ALT, BUN, and CRE levels.