Figures & data
Figure 1. Response surfaces of the lipid content, PSO dosage, and PLGA content of PSO-PLN and its response values. The preparation was made thrice, and the results were compared with prescribed ones. The deviation between the experimentally obtained values and predicted ones was less than 10%, indicating that the model fit was good.
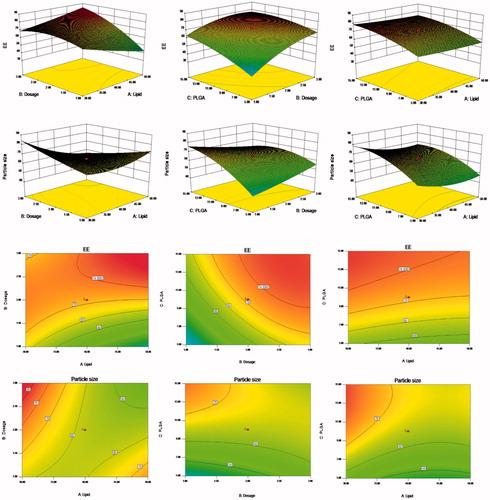
Figure 2. (a) Particle properties of PSO-PLN. (b) Transmission electron microscopy image of PSO-PLN after optimal formulation. (c) Properties of the optimal particle size of 93.59 ± 2.87 nm. (d) Properties of the optimal particle size of Zeta potential of −25.47 ± 2.84 mV. (e) In vitro drug (PSO) release profiles from PSO solution and PSO-PLN. Release was measured at neutral (pH 7.4) conditions at 37 ± 0.5 °C. Each point represents the mean (±SD) based on triplicate measurements. (f) FTIR spectra of (A) PSO, (B) PLN, (C) PSO + PLN, (D) PSO-PLN.
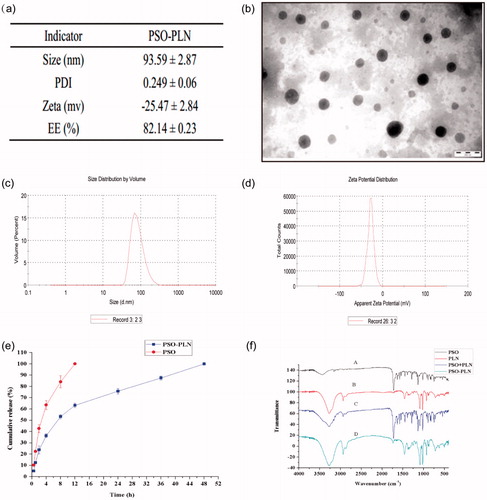
Figure 3. The cytotoxicity of various formulations against MCF-7 cells and MCF-7/ADR cells for 48 h. (a) Cell viability for MCF-7 cells treated with DOX at different concentrations ranged from 0.0615 to 8 μg/mL. (b) Cell viability for MCF-7/ADR cells treated with PSO at different concentrations ranged from7.27 to 930 μg/mL. (c) Cell viability for MCF-7/ADR cells treated with PSO-PLN and blank-PLN with different concentrations ranged from 0.156 to 20 μg/mL. (d) In vitro cytotoxicity of free DOX, free DOX + PSO, and DOX + PSO-PLN against MCF-7/ADR cells. The DOX was at a concentration ranged from 3.13 to 200 μg/mL. The cytotoxity assay was performed by MTT assay. Results are expressed as mean ± SD (n = 6).
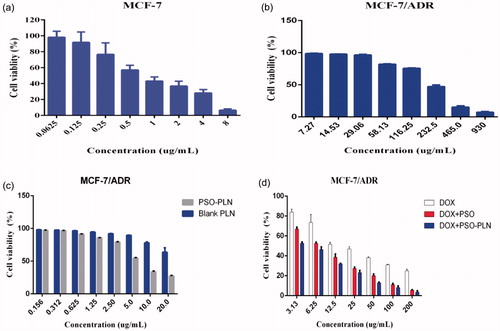
Figure 4. In vivo targeted fluorescence imaging of xenograft mice bearing MCF-7/ADR cells treated with DOX + PSO-SLN (a) or DOX + PSO-PLN (b) at 0, 1, 2, 4, 8,12 h. PSO-SLN and PSO-PLN were obtained by adding ICG during the preparation of PSO-SLN and PSO-PLN.
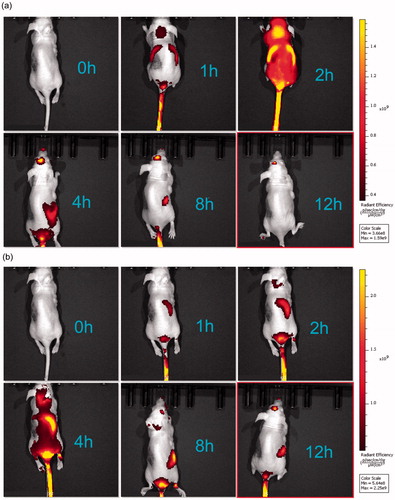
Figure 5. Evaluation of antitumor efficacy in vivo. (a) Body weight change of mice during various treatments. (b) Photographs of representative tumors from mice bearing MCF-7/ADR xenografts after treatment. (c) Changes in tumor volume of MCF-7/ADR tumor xenograft bearing nude mice from day 1 to day 21. (d) Tumor inhibition rate after antitumor treatment. Data points represent means ± SD, *p < 0.05 is considered statistically significant, n = 4 per group.
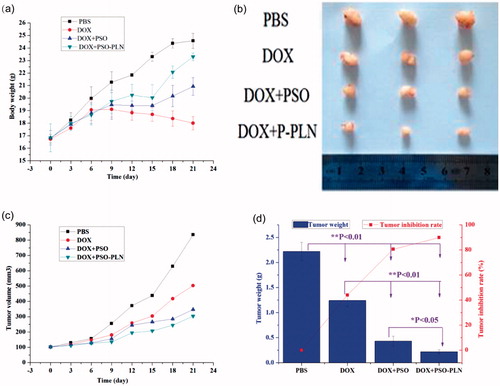
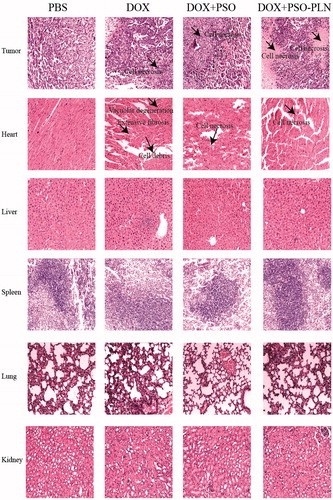
Figure 6. Pathological sections of tissues from mice bearing MCF-7/ADR xenografts after treatment. The organs sections were stained with hematoxylin and eosin. Scale bar is 5 μm.