Figures & data
Figure 1. (A) Strategy of bispecific antibodies (BsAbs and anti-mPEG/anti-HER2) non-covalently bound to a mPEGylated LsbMDDs to form the BsAbs-LsbMDDs, which can specifically target antigen-expressing cancer cells by passive and active targeting. (B) Size distributions of LsbMDDs(2K) and (C) LsbMDDs(5K) were measured using dynamic light scattering (DLS) and TEM micrographs of (D) the LsbMDDs(2K) and (E) LsbMDDs(5K) (scale bars =100 nm).
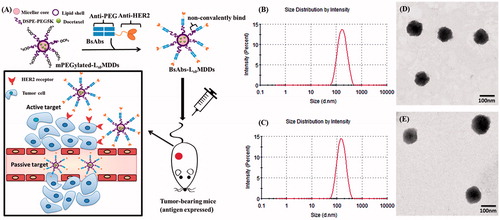
Figure 2. (A) Detection of BsAbs on HER2-LsbMDDs(2K or 5K) by a sandwich ELISA method (n = 3). (B) The optimal molar ratio of BsAbs to mPEG5K on the LsbMDDs(5K) was assessed at three different molar ratios of BsAbs to mPEG5K (of 0.002:1, 0.01:1, and 0.02:1) by an ELISA method (n = 3). *p < .05 compared to the LsbMDDs(0.01:1). (C) Cellular uptake of the LsbMDDs(2K and 5K), DNS-LsbMDDs(2K and 5K), and HER2-LsbMDDs(2K and 5K) with various molar ratios of BsAbs to mPEG (of 0.001:1, 0.002:1, 0.01:1, and 0.02:1) were measured by flow cytometry (n = 3).
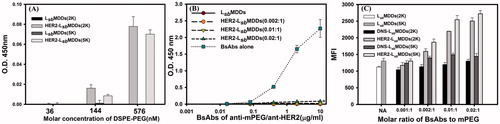
Figure 3. (A) The particles size of the LsbMDDs, DNS-LsbMDDs, and HER2-LsbMDDs during storage in PBS. (B) The binding activity of HER2-LsbMDDs during storage in PBS. (C) The particles size of the LsbMDDs, DNS-LsbMDDs, and HER2-LsbMDDs during storage in FBS. (D) The binding activity of HER2-LsbMDDs during storage in FBS. (E) Drug release profiles of Tynen®, the LsbMDDs, DNS-LsbMDDs, and HER2-LsbMDDs.
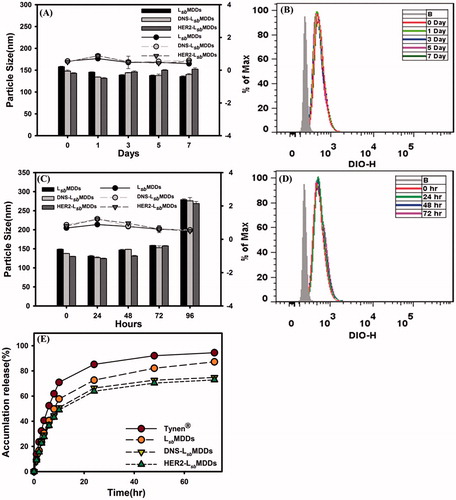
Figure 4. (A) Cell viabilities of Tynen®, the LsbMDDs, DNS-LsbMDDs, and HER2-LsbMDDs in the MCF-7/HER2, SKBR-3, and MCF-7 cell lines (n= 4). (B) Cellular uptake of the LsbMDDs, DNS-LsbMDDs, and HER2-LsbMDDs was examined by flow cytometry after incubating DIO-loaded formulations with the MCF-7/HER2, SKBR-3, and MCF-7 cell lines at the time points of 0.5, 2, and 8 h (n= 3). (C) Cells were treated with 5 μM of the DIO-loaded LsbMDDs for 2 h in the presence of various inhibitors. Uptake is presented as the percentage of the control. (D) Confocal images of MCF-7/HER2 cells after treatment with the LsbMDDs, DNS-LsbMDDs, and HER2-LsbMDDs for 2 h after triple fluorescence-labeling experiments: red fluorescence from LysoTracker, green fluorescence from DIO, and blue fluorescence from Hoechst 33342 for nuclei. Colocalization of red and green fluorescence was observed in cells (scale bar =20 μm). *p < .05, **p < .01, and ***p < .001 compared to the LsbMDDs.
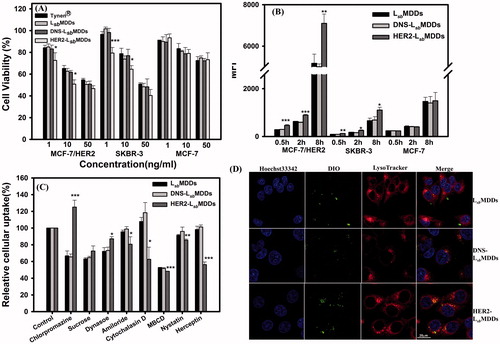
Figure 5. (A) Plasma concentration-time curves of docetaxel after intravenous administration of Tynen®, the LsbMDDs, DNS-LsbMDDs, and HER2-LsbMDDs at a dose of 8 mg/kg to rats (n= 3). (B) The MCF-7/HER2 tumor growth curve after intravenous administration at a dosing regimen of 5 mg/kg Q3D*4 (n= 6). (C) Body weight changes in tumor-bearing mice. (D) Tumor inhibition rates and (E) photographs showing the size of tumors after tumor-bearing mice were sacrificed on day 21. *p < .05 and ***p < .001 compared to the LsbMDDs on day 21.
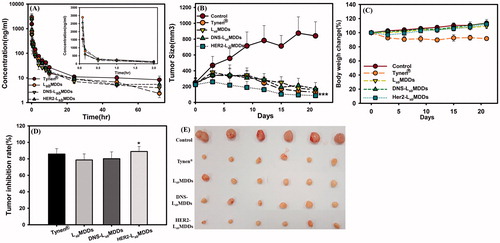
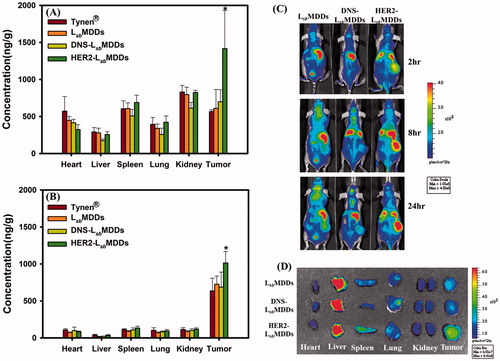
Figure 6. Tissue distributions of docetaxel (DTX) at (A) 2 and (B) 16 h after intravenous administration of Tynen®, the LsbMDDs, DNS-LsbMDDs, and HER2-LsbMDDs at a dose of 40 mg/kg into MCF-7/HER2 tumor-bearing nu/nu mice (n = 3). (C) Mice were imaged at 2, 8, and 24 h with an IVIS spectrum optical imaging system after being intravenously injected with the DIR-loaded LsbMDDs, DIR-loaded DNS-LsbMDDs, and DIR-loaded HER2-LsbMDDs (200 μg/kg of DIR). (D) Ex vivo fluorescence images of excised organs and tumors at 24 h post-injection of the LsbMDDs, DNS-LsbMDDs, and HER2-LsbMDDs in MCF-7/HER2 tumor-bearing nu/nu mice. *p < .05 compared to the LsbMDDs.