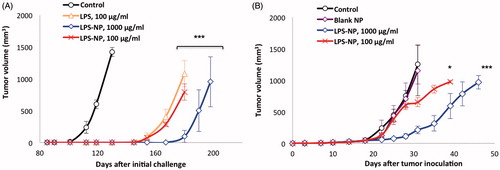
Figures & data
Figure 1. In vitro characterization of LPS-NP and the associated pro-inflammatory properties. A) Scanning electron microscopic examination of the LPS-NP morphology (scale bar represents 1 µm). B) LPS release from the nanoparticles under sink conditions. C) LC50 values calculated based on the dose-response fitting of cell survival values following the overnight incubation of 4 × 10⁵ RAW 264.7 macrophages or JAWS II DCs with different concentrations of LPS and LPS-NP. D) Co-localization of LPS and nanoparticles following overnight incubation of macrophages with LPS-NP (Pearson’s correlation for 50 cells: 0.8666 ± 0.03964, Mander’s overlap for 50 cells: 0.8693 ± 0.0396). Blue, red, green, and yellow colors represent the cell nucleus, nanoparticles, LPS, and the co-localization of the LPS and nanoparticles, respectively. Scale bars represent 10 µm. E) Induction of NF-κBp65 in 5 × 10⁶ RAW 264.7 macrophages following 6 h incubation with LPS/LPS-NP. RAW 264.7 cells with TLR4 blocked signaling have been used as control to enable the determination of the TLR4-independent induction of NF-κBp65, potentially related to the PLGA matrix or impurities. F) Induction of pro-inflammatory cytokines following the overnight incubation of 4 × 10⁵ RAW 264.7 macrophages or JAWS II DCs with LPS, LPS-NP, and blank PLGA nanoparticles with polymer concentrations corresponding to those of LPS-NP.
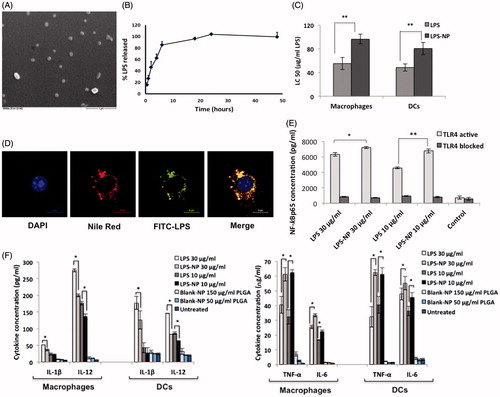
Figure 2. Comparison of the immunotherapeutic potentials of LPS and LPS-NP in tumor-splenocyte co-cultures. Apoptosis induction in C26-splenocyte co-culture treated overnight with LPS or LPS-NP investigated through A) flow cytometric analysis of Annexin V and PI-stained C26 cells (quadrants were set based on untreated C26 cells cultured without the splenocytes), B) the resulted percentage of early apoptosis cells, and C) quantification of caspase 3 levels within the cellular extracts.
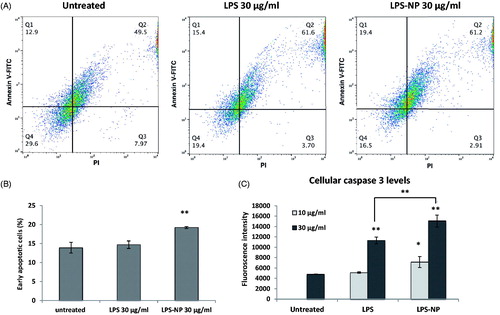
Figure 3. Comparison of the immunotherapeutic efficiency and tolerability of LPS and LPS-NP in vivo. A) Schematic of the animal trials, B) complete tumor regression was observed after the administration of 4–5 doses of LPS (100 µg/mL) and LPS-NP (both 1000 and 100 µg/mL), while C) severe necrosis occurred in the animals treated with 1000 µg/mL LPS solution. D) Localized necrosis was observed following the peritumoral injection of 1000 µg/mL LPS solution (D-1) and LPS-NP prepared three days prior to the treatment with more than 90% released LPS (D-2). No necrosis was observed in the group treated with freshly prepared LPS-NP (D-3), which signifies the LPS decoration to be the main reason for lack of post-injection necrosis. Serum TNF-α (E) and LPS (F) levels were measured 24 h following the peritumoral injection of the first dose of LPS/LPS-NP at high concentrations (1000 µg/mL). Data are also presented for healthy and cancerous (PBS-treated) control animals. Significantly higher concentration of both TNF-α and LPS was observed in the animals treated with LPS solution, as evidence of the necrosis being localized Shwartzman phenomenon. The results are presented as the mean ± SD of the experiments on five different animals per each group.
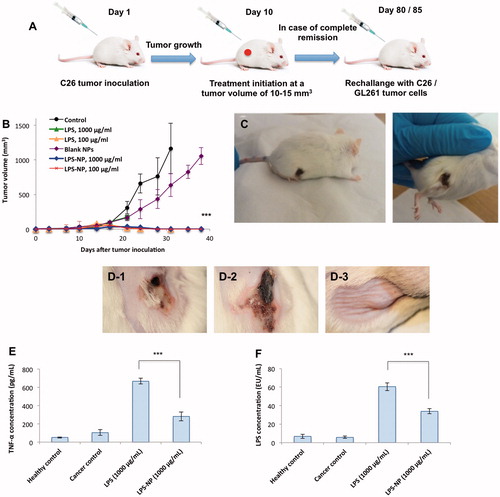
Figure 4. Microscopic evaluation of the tumor cross-sections. A) Intratumoral LPS penetration and deposition 1 and 24 h after the peritumoral injection of LPS/LPS-NP (100 µg/mL). The width of each individual field and the distance between two consecutive cross sections are 258 and 5 μm, respectively. B) Intratumoral infiltration of macrophages (CD14 + cells) in the animals treated with PBS (control), and 100 µg/mL of LPS or LPS-NP. CD14 + cells are shown in pink while the nuclei are dyed blue. Scale bars represent 10 µm. C) Analysis of the percentage of the CD14 + stained surface area from 10 independent fields captured from various areas of three tumor cross-sections indicating significantly higher intratumoral infiltration of the CD14 + cells in the animals treated with LPS-NP compared to the other groups.
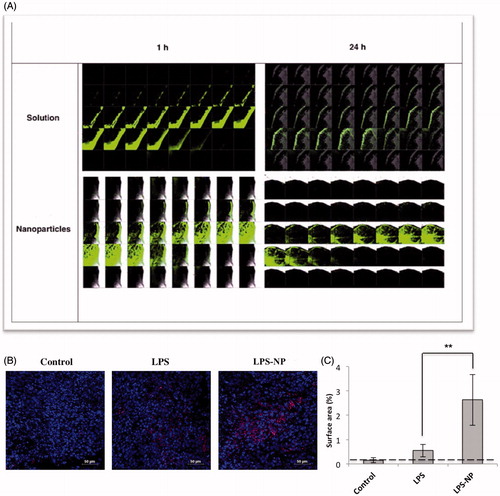
Figure 5. Cross-immunity and the importance of the localized injection of the nanoparticles close to the tumor site. A) Investigation of cross-immunity through the injection of GL261 cells in the left flank of the mice previously recovered from syngeneic colorectal cancer and B) tumor growth following the inoculation of C26 cells in the right flank and biweekly injection of LPS-NP in the left flank of the mice.